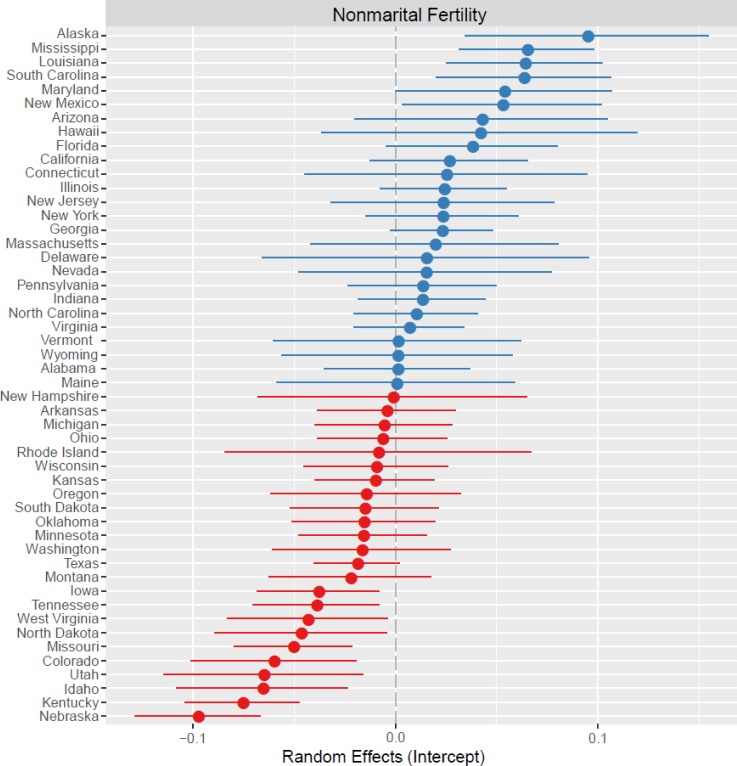
Fig 3. Plot of the random effects for the outcome variable Nonmarital Fertility.
State-level deviations are shown relative to the mean (0.00; gray dashed line) with 95% confidence intervals around the intercept (closed circle). Blue circles represent intercepts higher than the mean and red circles lower than the mean.

