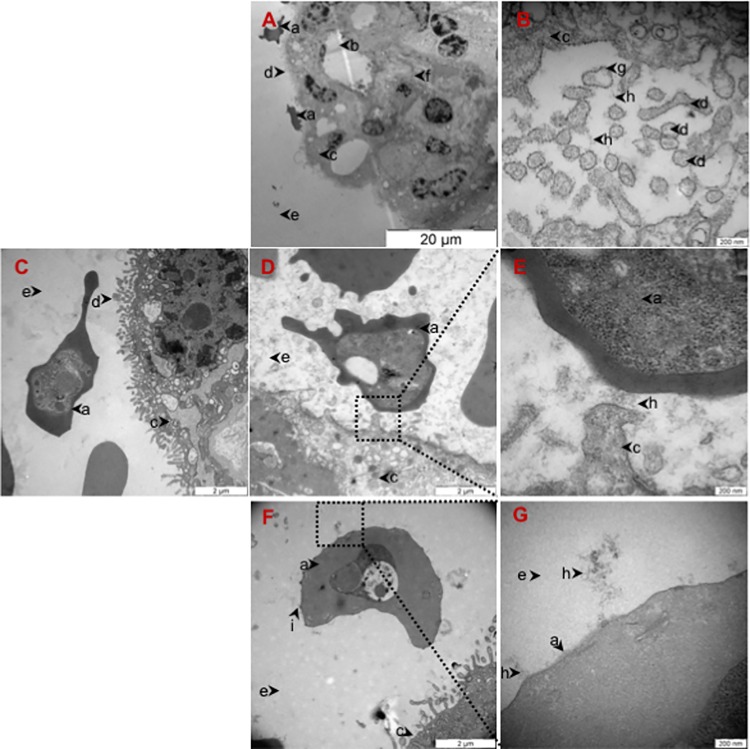
Fig 1. Infected Erythrocytes adhere to CS present on the syncytiotrophoblast and in the intervillous space in the placenta.
(A) Transmission electron microscopy (TEM) of placental tissue glycosaminoglycans (GAGs) stained with 1% ruthenium red (RR) showing a fetal villus covered with syncytiotrophoblast. The surface of the syncytiotrophoblast is covered with microvilli. Two infected erythrocytes adhere to the apical membrane of the syncytiotrophoblast. Scale bar represents 20 μm. (B) TEM of placental tissue GAGs stained with 1% RR showing cross-sections of syncytiotrophoblast microvilli with the apical double layer plasma membrane surrounded by RR stained GAGs. Scale bar represents 200 nm. (C) TEM of control placental tissue perfused with VAR2CSA-expressing infected erythrocytes and not stained with RR. Scale bar represents 2 μm. (D) TEM of placental tissue perfused with VAR2CSA-expressing infected erythrocytes and stained with 1% RR showing the presence of GAGs where an infected erythrocyte is adhering to the syncytiotrophoblast membrane. Scale bar represents 2 μm.(E) TEM of higher magnification of the region outlined with a black square in (D) showing the presence of GAGs in between an infected erythrocyte and the syncytiotrophoblast. Scale bar represents 200 nm. (F) TEM of placental tissue stained with 1% RR showing an infected erythrocyte in the intervillous space close to the syncytiotrophoblast. Stained GAGs connected to knobs on an infected erythrocyte. Scale bar represents 2 μm. (G) TEM of higher magnification of the region outlined with a black square in (F) showing the presence of GAGs chains attached to knobs on an infected erythrocyte. Scale bar represents 200 nm.[a: infected erythrocyte; b: fetal capillary; c: syncytiotrophoblast; d: syncytiotrophoblast microvilli; e: intervillous space; f: villous stroma; g: double lipid layer; h: stained GAGs; i: knob].

