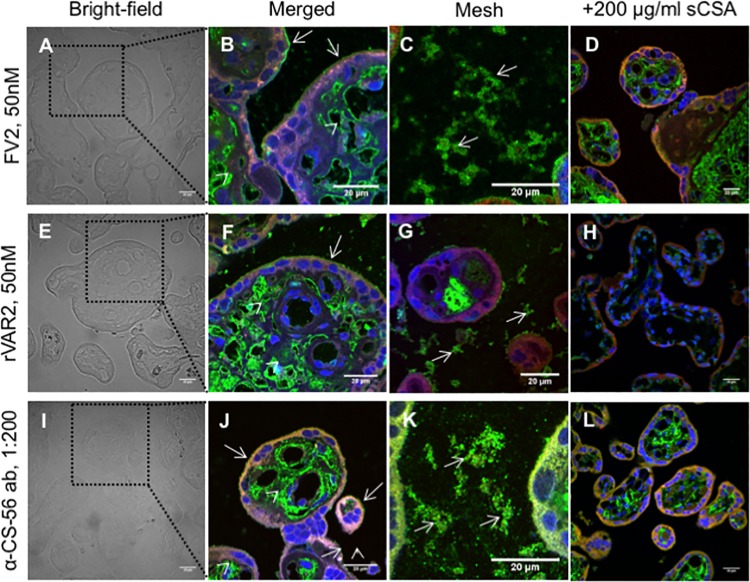
Fig 2. Placental chondroitin sulfate recognized by VAR2CSA is present on the syncytiotrophoblast and in the intervillous space of the placenta.
Fresh placental tissue was perfused with VAR2CSA-expressing parasites before biopsies were collected and stained. A) Bright-field of placental tissue. The region delineated by a black dotted square is shown in (B). Scale bar represents 20 μm. (B) Full-length VAR2CSA (FV2) immunostaining show expression of placental CS in the villous stroma (arrow heads) and in the apical membrane of the syncytiotrophoblast (arrows). The image is a composite of three distinct channels: blue (nuclei), green (placental CS stained by FV2), and red (placenta auto-fluorescence). Scale bar represents 20 μm. (C) FV2 immunostaining showing the expression of placental CS in mesh-like structures (arrows). The image is a composite of three distinct channels: blue (nuclei), green (placental CS stained with FV2), and red (placenta auto-fluorescence). Scale bar represents 20 μm.(D) Addition of soluble CSA (sCSA) out-competes FV2 binding to placental tissue. The image is a composite of three distinct channels: blue (nuclei), green (placental CS stained with FV2), and red (placenta auto-fluorescence). Scale bar represents 20 μm. (E) Bright-field of placental tissue. The region delineated by a black dotted square is shown in (F). Scale bar represents 20 μm. (F) Recombinant VAR2CSA (rVAR2) immunostaining show the expression of placental CS in the villous stroma (arrow heads) and in the apical membrane of the syncytiotrophoblast (arrows). The image is a composite of three distinct channels: blue (nuclei), green (placental CS stained with rVAR2), and red (placenta auto-fluorescence). Scale bar represents 20 μm. (G) rVAR2 immunostaining show expression of placental CS in mesh-like structures (arrows). The image is a composite of three distinct channels: blue (nuclei), green (placental CS stained with rVAR2), and red (placenta auto-fluorescence). Scale bar represents 20 μm.(H) Addition of soluble CSA (sCSA) out-competes rVAR2 binding. The image is a composite of three distinct channels: blue (nuclei), green (placental CS stained with rVAR2), and red (placenta auto-fluorescence). Scale bar represents 20 μm. (I) Bright-field of placental tissue. A region delineated by a black dotted square is shown in (I). Scale bar represents 20 μm. (J) Anti-CS-56 antibody (α-CS-56 ab) immunostaining show the expression of CS in the villous stroma (arrow heads) and in the apical membrane of the syncytiotrophoblast (arrows). The image is a composite of three distinct channels: blue (nuclei), green (CS stained with α-CS-56 ab), and red (placenta auto-fluorescence). Scale bar represents 20 μm. (K) α-CS-56 ab immunostaining show the expression of CS in mesh-like structures (arrows). The image is a composite of three distinct channels: blue (nuclei), green (CS stained with α-CS-56 ab), and red (placenta auto-fluorescence). Scale bar represents 20 μm.m(L) Addition of soluble CSA (sCSA) out-competes α-CS-56 ab binding. The image is a composite of three distinct channels: blue (nuclei), green (CS stained with α-CS-56 ab), and red (placenta auto-fluorescence). Scale bar represents 20 μm.

