
Figure 2. Trx-depletion negatively affects transcription at PRE-regulated genes, and results in decreased H3K4-methylation and H3K27ac at nearby enhancers.
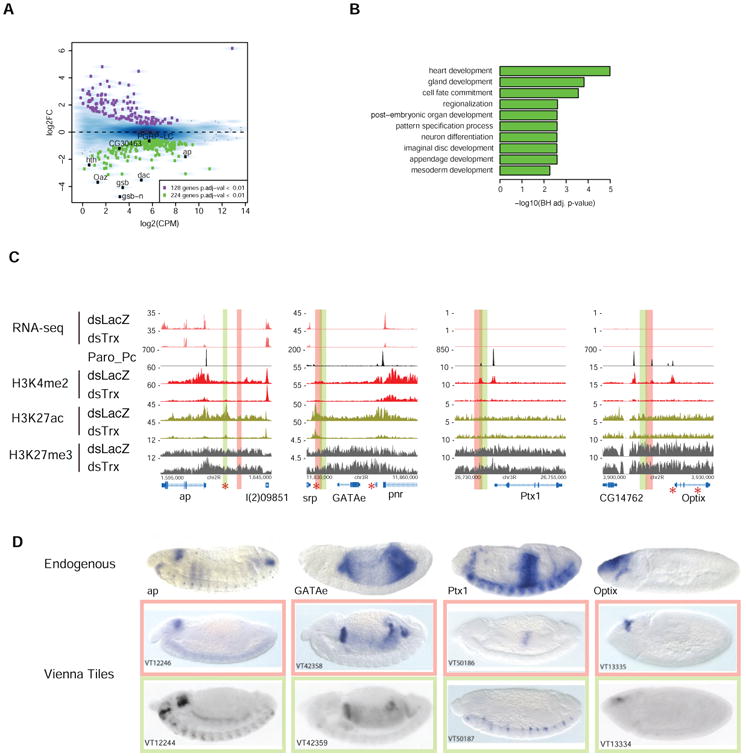
(A) Analysis of RNA-seq after Trx-RNAi. MA-plot shows of the 224 down-regulated genes (green boxes), 8 overlap with 161 PRE-nearest genes (black boxes). (B) For the nearest genes associated with the 161 sites (127 genes), select top GO biological process results are displayed. (C) Track examples of decreased transcription at pnr and ap following Trx-RNAi, and accompanying changes in chromatin modification at these genes, as well as at Ptx1 and Optix. PRC1 remains bound at the PRE whether the gene is active or repressed. STARR-seq enhancers identified in S2 cells (red star) and embryonic enhancers (red and green columns) show the close, sometimes overlapping, proximity to PREs. Note the effect of Trx-RNAi on H3K4me2 and H3K27ac at ap enhancers. (D) PRE-associated enhancers give embryonic expression patterns that resemble that of the endogenous gene. Colored boxes in C correspond to a ∼2kb fragment from the Vienna Tiles library that drives the corresponding LacZ expression patterns shown in D. Note, the Ptx1 endogenous expression pattern is a composite of the two Vienna Tiles (peach and green boxes) that partially overlap at the Ptx1 PRE. Embryos are stages 13-14, except for optix (stage 8-9). Vienna Tile embryo images are from (Kvon et al., 2014). Red asterisks indicate STARR-seq enhancers in S2 cells (Arnold et al., 2013).