
Figure 4. MLL1 target-genes are transcriptionally balanced by PRC2.
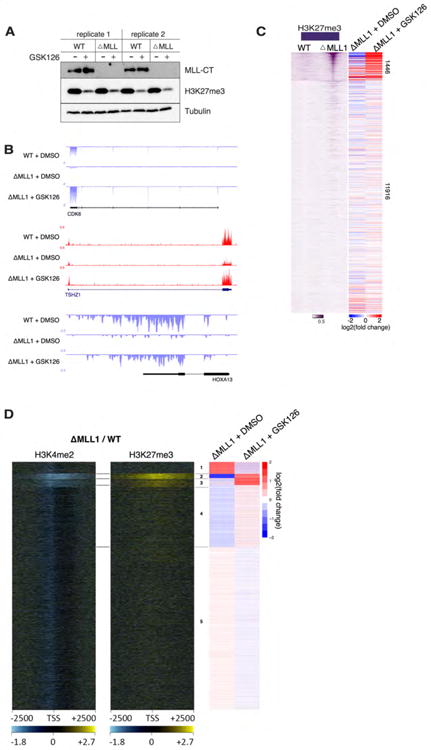
(A) Western blot showing lack of MLL1 protein in MLL1NULL HCT116 cells and diminished H3K27me3 levels following 4 day GSK126 treatment. (B) Representative RNA-seq track examples of MLL1 target-genes whose expression is rescued in MLL1NULL cells following GSK126 treatment. (C) Left panel, heatmaps ordered identically to that in Fig. 2C, showing increased TSS-associated H3K27me3 in MLL1NULL cells. Right panels, heatmaps showing the corresponding log2 fold-changes in gene expression in MLL1NULL and MLL1NULL + GSK126, compared to WT cells. Note the substantial changes in gene expression coinciding with MLL1-dependent group. (D) K-means clustering was used to partition all protein-coding genes by their log2 fold-changes in expression following MLL1NULL treatment with GSK126. To the left are heatmaps showing decreased H3K4me2 and increased H3K27me3 in MLL1NULL cells. Notice that changes in these modifications correspond exactly with the MLL1-dependent “balanced” genes (cluster 2) and other remaining MLL1 target-genes that are de-repressed following GSK126 treatment (cluster 3).