Figure 3.
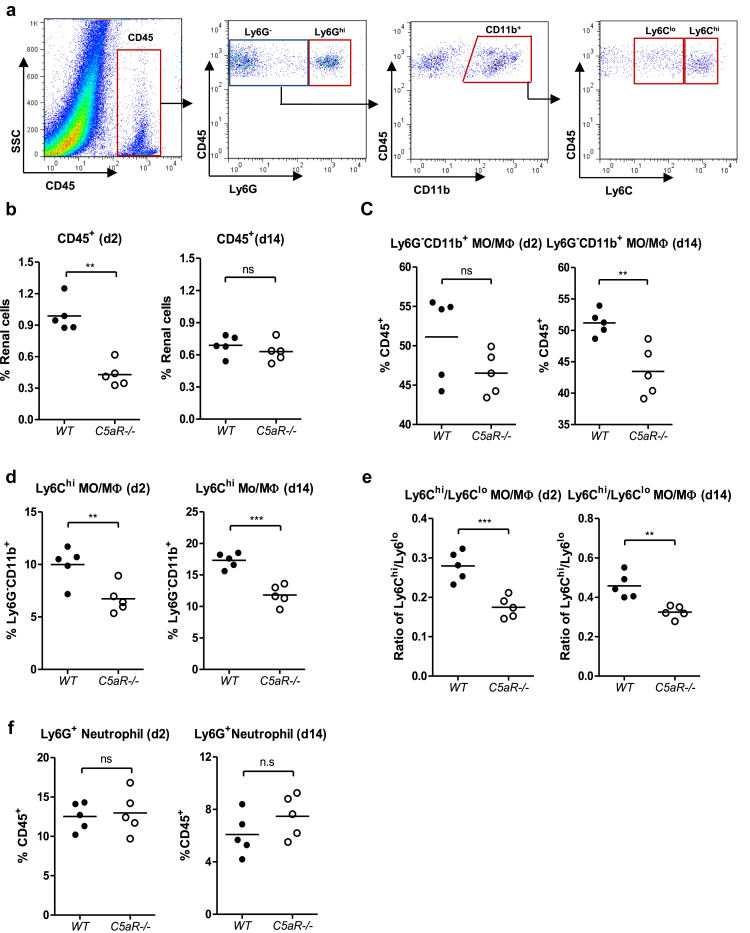
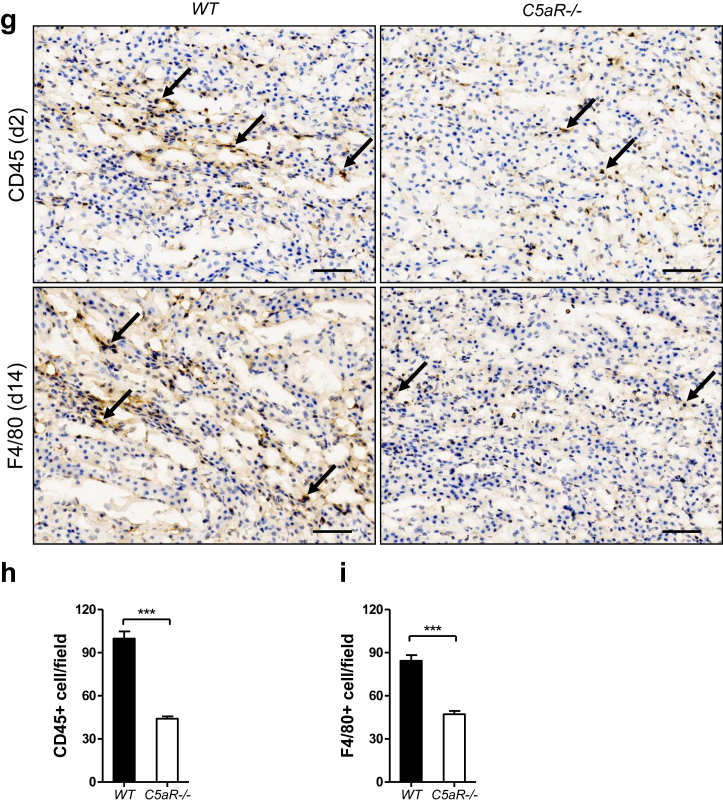
C5a receptor (C5aR) deficiency influences the extent and phenotype of cellular infiltrates in the kidneys following renal infection. Renal inflammatory cell infiltration was analyzed in infected wild-type (WT) and C5aR1-/- mice at days 2 and 14 after infection by flow cytometry. (a) Stepwise gating strategy used in flow cytometric analysis of leukocytes, neutrophils, monocytes/macrophages (MO/MΦs), and Ly6chi MO/MΦs in kidney tissues. (b–f) Quantification of leukocytes (CD45+), MO/MΦ (Ly6G-CD11b+), Ly6chi population, and ratio of Ly6chi to Ly6clo populations within the Ly6G-CD11b+ compartment and neutrophils (Ly6G+), respectively. Each dot represents an individual mouse. Data were analyzed by Student’s t test (n = 5 mice per group). **P < 0.05. ***P < 0.005. (g–i) Immunohistochemistry. (g) Representative images of CD45- and F4/80-stained kidney sections from infected WT and C5aR1-/- mice (n = 4 mice per group). Arrows show positively stained cells. Bar = 100 μm. (h,i) Quantification of CD45+ and F4/80+ cells. Data were analyzed by Student’s t test (40–50 viewing fields [0.04 mm2 per field] from 4 mice per group). ***P < 0.001. A representative of 2 independent experiments is shown.


