
Figure 5.
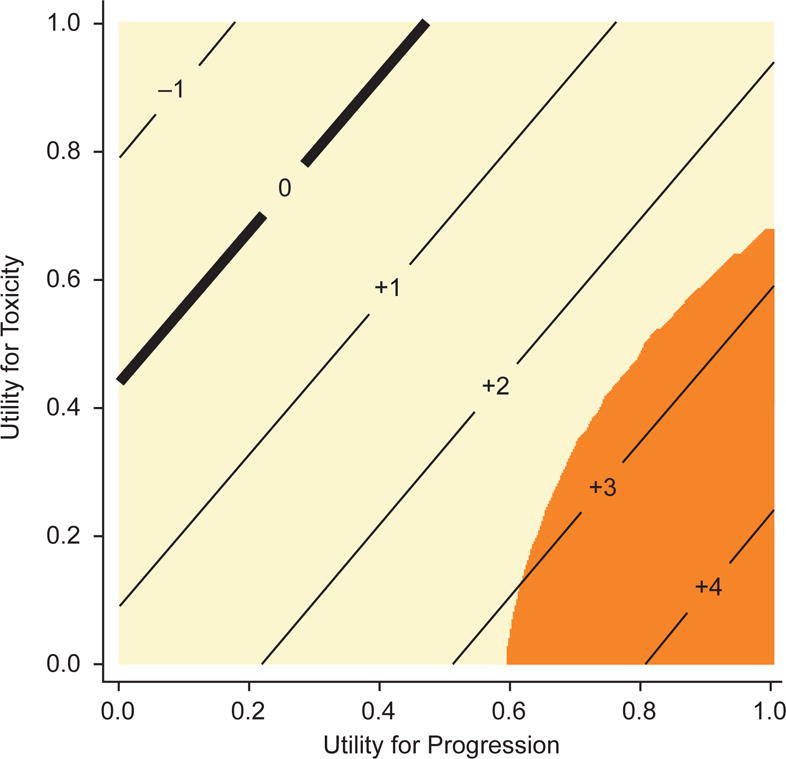
Threshold plot, TOX defined as grade 2 or higher. Integers represent the estimated difference in Q-TWiST between arms (in weeks) for the corresponding combination of utilities for toxicity and progression; orange-shaded areas are significantly different from zero, in favor of pazopanib; tan-shaded areas indicate no significant difference. Abbreviations: Q-TWiST, quality-adjusted time without symptoms or toxicity; TOX, time with grade 2 or higher toxicity.