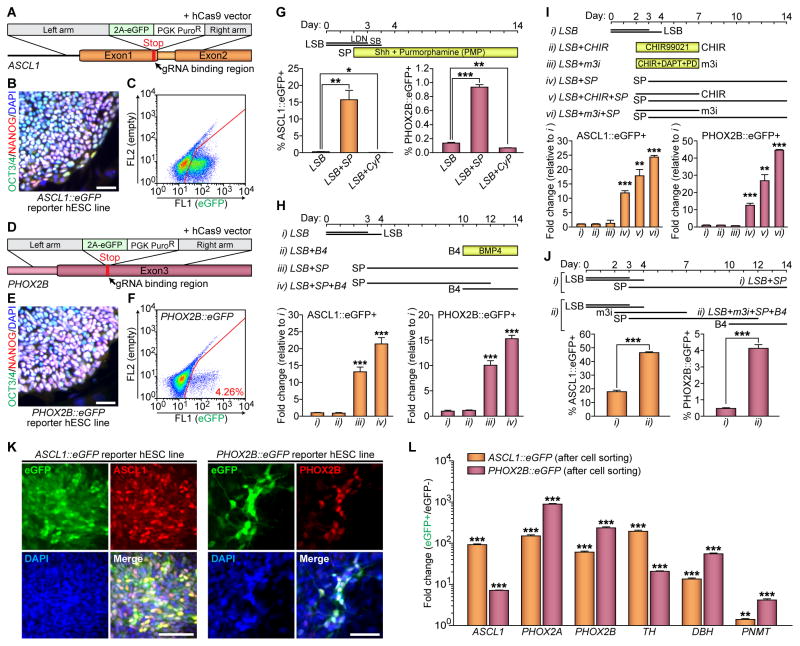
Figure 1. Activation of WNT Followed by SHH Signaling Leads Both ASCL1 and PHOX2B Inductions in hPSC-Derived Autonomic Specification.
(A and D) Schematics for ASCL1 and PHOX2B gene targeting using homologous recombination enhanced by CRISPR/Cas9 system. (B and E) Immunofluorescence analyses were performed using OCT3/4 (green) and NANOG (red) antibodies. Representative images of OCT3/4+/NANOG+ colonies from the undifferentiated ASCL1::eGFP (B) and PHOX2B::eGFP (E) reporter lines. (C and F) Representative FACS plots of differentiated reporter hESC lines for either (C) ASCL1 or (F) PHOX2B. (G–J) Top, schematics for differentiation; bottom, after addition of (G) the recombinant sonic hedgehog C25II (Shh) protein and SHH agonist (purmorphamine, PMP) or SHH antagonist (cyclopamine, CyP) to the LSB protocol, (H) BMP4 (B4) to the LSB-SP protocol, (I) CHIR99021 (CHIR) and ‘modified-3i’ (m3i; CHIR, DAPT, and PD173074) to the LSB-SP protocol, or (J) m3i and B4 to the LSB protocol, the percentages of ASCL1::eGFP− and PHOX2B::eGFP-expressing cells was measured by using FACS analysis (* P < 0.05; **P < 0.01; ***P < 0.001; unpaired Student’s t-test; n = 3). LSB, LDN193189 and SB431542. SP, Shh plus PMP. (K) Immunofluorescence analyses were performed at day 10 following LSB (day 0–3/4) – m3i (day 2–7) – SP (day 3–10) treatment, using GFP (green) and either ASCL1 (red) or PHOX2B (red) antibodies. (L) qRT-PCR data showing enrichments of each transcript after cell sorting (**P < 0.01; ***P < 0.001; compared to eGFP− population; unpaired Student’s t-test; n = 3). All error bars represent mean + S.E.M. Scale bars, 50 μm. See also Figure S1.

