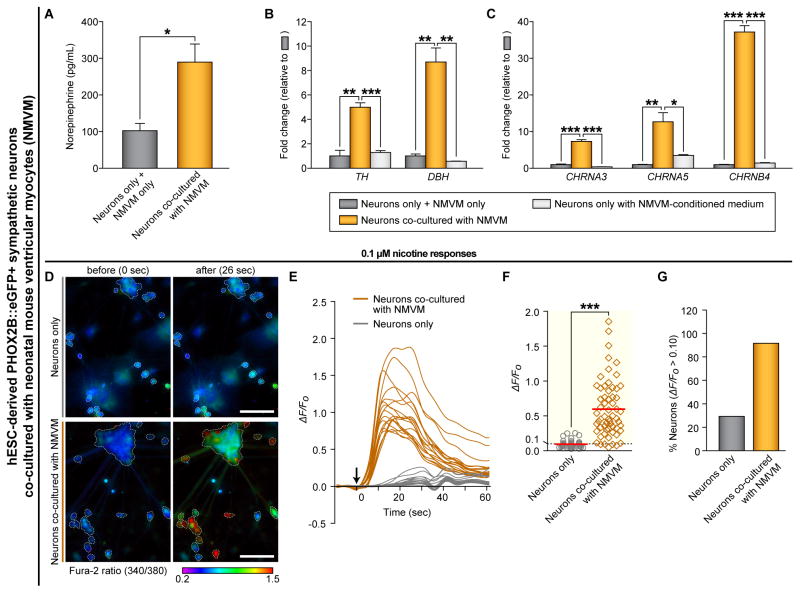
Figure 6. Physical Interaction Between hPSC-Derived Sympathetic Neurons and Ventricular Myocytes Leads to Neuronal Maturation Phenotypes.
(A) The amounts of norepinephrine release after 50 mM KCl administration were analyzed by using commercial ELISA kit (*P < 0.05; unpaired Student’s t-test; n = 3). Neurons, hESC-derived PHOX2B::eGFP+ sympathetic neurons. NMVM, neonatal mouse ventricular myocytes. (B–C) We used the ‘neurons only with NMVM-conditioned medium’ control (one day conditioned medium of NMVM was collected and fed to ‘neuron only’ sample daily for 7 days). The RNA from ‘neurons only’ samples and ‘NMVM only’ samples were mixed together and used as a ‘neurons only + NMVM only’ control. qRT-PCR analyses were performed by using indicated human-specific primers (*P < 0.05; **P < 0.01; ***P < 0.001; unpaired Student’s t-test; n = 3). (D–G) The changes in intracellular calcium concentrations [Ca2+]i induced by 0.1 μM nicotine were measured by ratiometric Fura-2 imaging. Calcium responses were calculated as the ratio of Fura-2 light emission on excitation at 340 and 380 nm (340/380) or the normalized ratio (ΔF/F0; ΔF = (F − F0), F = the 340/380 at a given time point, F0 = the mean basal, unstimulated 340/380 of each cell). White boundaries in (D) indicate the cell bodies of neurons which satisfy the criterion for selecting neurons as described in Supplemental Experimental Procedures. (E) Example traces of ΔF/F0 intensity from the neurons co-cultured with (dark orange lines) or without (gray lines) NMVM exposed to 0.1 μM nicotine. Each trace is a response from a unique cell (n = 18). (F) ΔF/F0 intensity plot showing the response of individual cells to 0.1 μM nicotine (***P < 0.001; unpaired Student’s t-test; neurons only, n = 41; neurons with cardiomyocytes, n = 60). Red lines indicate each mean value. (G) The percent of total responder neurons (ΔF/F0 > threshold) in each sample. All error bars represent mean + S.E.M. See also Figure S6 and Movie S5.

