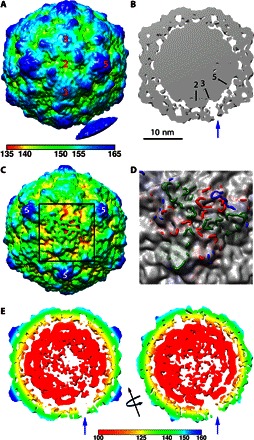
Fig. 4. Extending densities from the in situ CVB3 A-particle.

(A) The asymmetric reconstruction is radially colored according to the key and surface-rendered at low contour to show the connection extruding from a single threefold to a nanodisc density. (B) A thin slice through the center of the map (gray density with symmetry axes marked) shows how the extruding density is visualized as a unique threefold pore (blue arrow) through the capsid shell at 2σ contour. (C) When the map with the same radial coloring as (A) is surface-rendered at 1.5σ, the unique site on the capsid adjacent to the nanodisc (black square outline) shows distinct weak density resulting from different protein extrusions becoming flexible upon extension. (D) The fitted capsid structure rendered in blue, red, and green wire for VP1, VP2, and VP3, respectively, shows how the protein loops extend through the weak capsid density at this asymmetric location only. (E) Left: A thin slice oriented the same as (B) but rendered at 2.75σ shows asymmetrically disordered genome densities. Right: The map was rotated 90° around the threefold axis (black arrow). Both slices are radially colored according to the key.
