. 2016 Aug 23;5:e16351. doi: 10.7554/eLife.16351

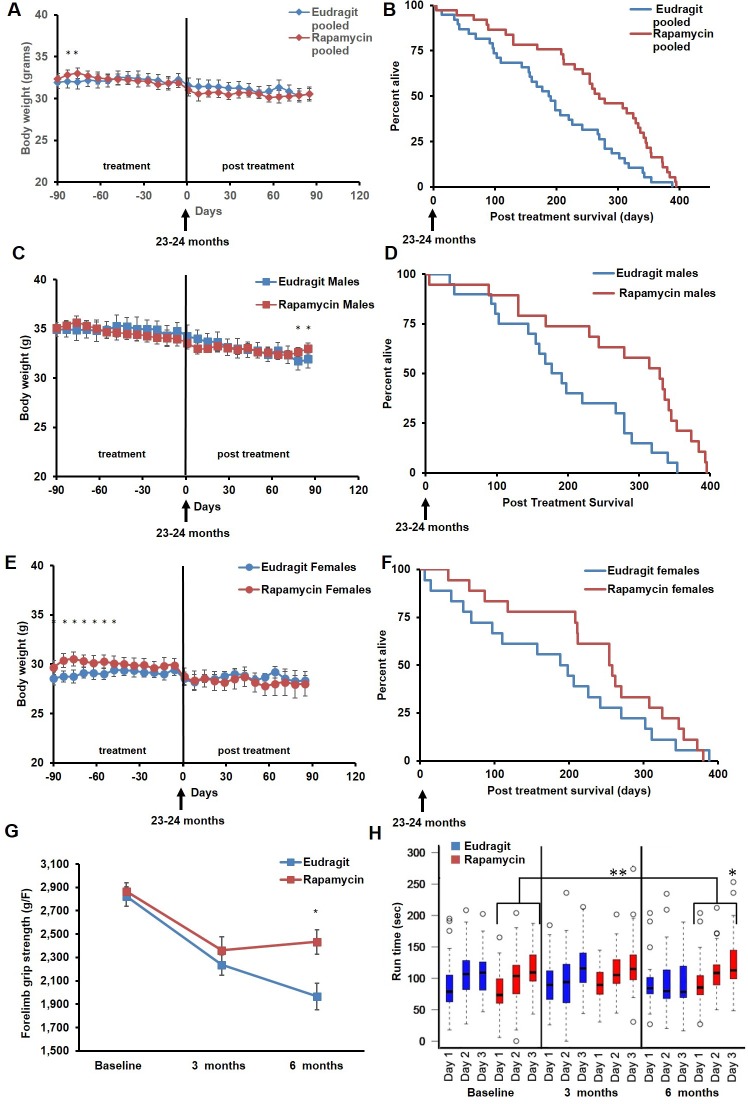
Figure 4. Rapamycin feeding at 126 ppm for 3 months extends life expectancy.

(A, C, E) Body weight of (A) sex-pooled, (C) male, and (E) female mice measured weekly after starting rapamycin and eudragit treatment. *p<0.05. Survival of (B) sex-pooled control and rapamycin-treated mice following the end of treatment. p=0.002. N=38 vehicle injected, N=37 rapamycin. (C). Survival of (D) male, and (F) female control and rapamycin-treated mice following the end of treatment. (D) N=20 eudragit males, N=19 126 ppm eRapa males. (F) N=18 eudragit females, N=18 eRapa females. (G) Forelimb grip strength tests measured prior to treatment initiation (baseline), upon cessation of treatment (3 months), and 3 months after the drug withdrawal (6 months). (H) Rotarod performance tested prior to treatment initiation (baseline), upon cessation of treatment (3 months), and 3 months after the drug withdrawal (6 months). Data are plotted with box-whisker plots, showing median, 25th and 75th percentile, as well as individual outliers. Statistical significance was calculated with a linear mixed-effect model, using treatment group, measurement date, and measurement day as fixed effects and individual mice identifiers as random variables. *p<0.05 rapamycin vs. control at 6 months. **p<0.01 rapamycin at 6 months vs. rapamycin at baseline.

DOI: http://dx.doi.org/10.7554/eLife.16351.017

Figure 4.

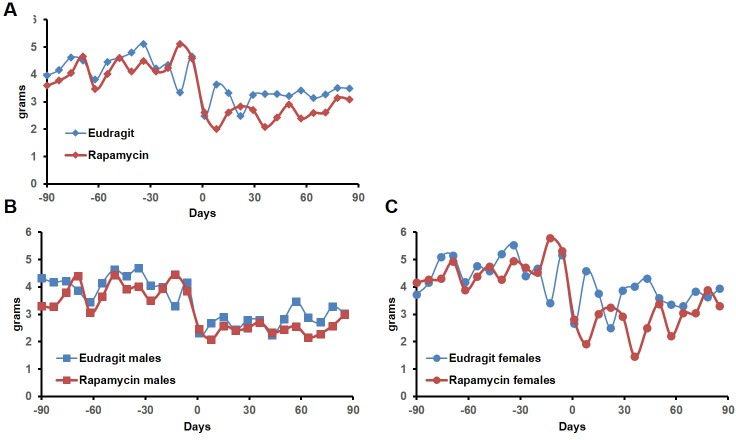
Figure 4—figure supplement 1. Food intake of mice receiving 126 ppm eRapa or eudragit control.

Figure 4—figure supplement 1.

Food intake measured weekly by weighing the food given to each cage and the food remaining on the wire rack in each cage after 5–7 days.

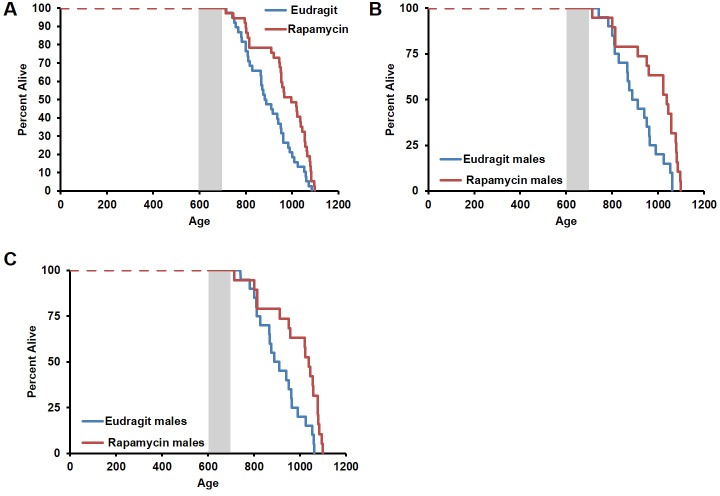
Figure 4—figure supplement 2. Effects of 126 ppm eRapa treatment on lifespan in male and female mice.

Figure 4—figure supplement 2.

(A) Survival plots of sex-pooled mice treated with 126 ppm eudragit or eRapa for 90 days starting around 600 days of age. Note: although the curves start at age=0 to represent all of life, we have no data on animals that may have died in this cohort prior to receipt from NIA. Gray box approximately indicates treatment period. N=38 vehicle injected, N=370 eRapa. (B, C) Sex-segregated survival plots of male (B) and female (C) mice fed 126 ppm eudragit or eRapa for 90 days starting around 600 days of age. Note: although the curves start at age=0 to represent all of life, we have no data on animals that may have died in this cohort prior to receipt from NIA. Gray box approximately indicates treatment period. (B) N=20 eudragit males, N=19 126 ppm eRapa males. (C) N=18 eudragit females, N=18 eRapa females.

Figure 4—figure supplement 3. Inclusion of non-age-related deaths does not alter survival outcomes.

Figure 4—figure supplement 3.

(A, B). Survival plots of (A) male and (B) sex-pooled mice fed 126 ppm eudragit or eRapa for 90 days including deaths during the treatment period from non-age-related causes.(A) N=38 vehicle injected, N=38 eRapa. (B) N=20 eudragit males, N=20 126 ppm eRapa males.