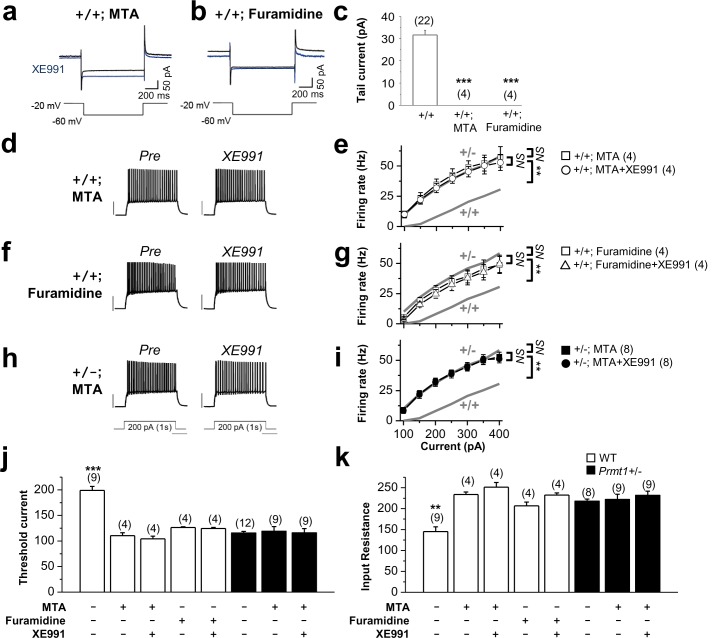
Figure 4. Methylation suppression with MTA or furamidine, increases neuronal excitability via KCNQ channel.
(a–b) Representative current traces recorded from MTA- (a) or furamidine- (b) pretreated WT GCs using the voltage protocol depicted below in the absence (black) or presence (blue) of 10 μM XE991. (c) Summary of M-currents from experiments shown in a–b. Data for M-currents of WT control shown in Figure 3c is also shown as a reference. ***p<0.001 by Student’s t-test. (d–i) APs were evoked by applying 1-s depolarizing current pulses of different intensities (100–400 pA) in WT (d–g) or Prmt1+/- (h–i) neurons. Panel d, f, and h illustrate representative traces after incubation for 1 hr with 100 μM MTA (d and h) or 20 μM furamidine (f). The effect of applying XE991 once the maximal effect of MTA or furamidine is achieved was shown in right. Scale bar indicate 40 mV. Summarized data compare the number of APs before and after application of XE991 in MTA-pretreated WT (e), furamidine-pretreated WT (g), and MTA-pretreated mutants (i). The gray lines shows the number of APs observed in untreated WT and Prmt1+/- neurons. Genotypes are given on each line. Firing rate in MTA-treated WT cells (□; n = 4, two mice) or furamidine-treated WT cells (□; n = 4, three mice) increased to the level of Prmt1+/- cells (gray line). Further, XE991 had no effect in MTA-treated WT cells (○; n = 4, paired Student’s t tests) or furamidine-treated WT cells (△; n = 4, paired Student’s t tests). MTA had no further effects on Prmt1+/- neurons. NS, not significantly different. (j–k) the mean value of threshold current for AP generation (j) and input resistance (k). ANOVA Tukey test. **p<0.02; ***p<0.001.
DOI: http://dx.doi.org/10.7554/eLife.17159.011

