. 2016 Jul 28;5:e17159. doi: 10.7554/eLife.17159

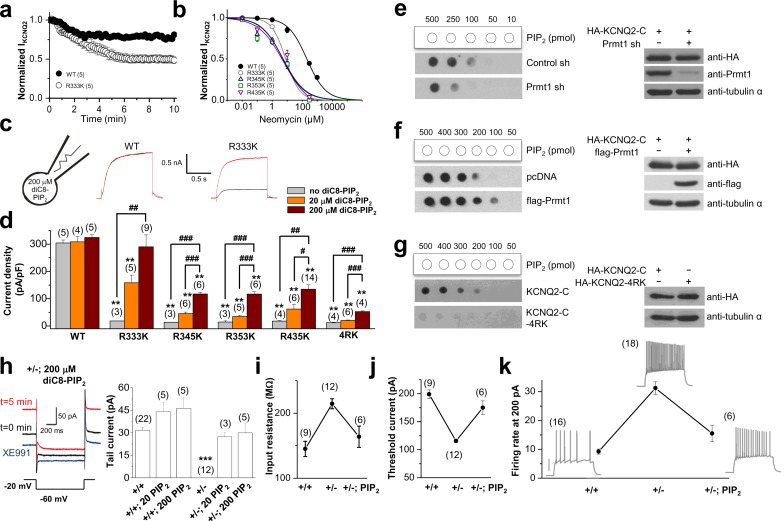
Figure 7. Methylation of KCNQ2 determines its PIP2 affinity.

(a) Pooled data show 10 μM neomycin-induced rundown of WT (●) and R333K (○) KCNQ2 currents. KCNQ2 currents were normalized to KCNQ2 current at t = 0. (b) Dose-response curves for neomycin measured at 10 min after rupturing the plasma membrane. Indicated concentration of neomycin was included in the patch pipette. Solid lines are Hill fits to the mean data for WT, R333K, R345K, R353K, and R435K giving IC50 values of 59.1 ± 8.3, 9.2 ± 4.2, 5.2 ± 0.2, 5.4 ± 3 and 6.2 ± 8 μM and slopes of 0.8 ± 0.05, 0.8 ± 0.3, 0.6 ± 0.1, 0.6 ± 0.2, and 0.5 ± 0.2, respectively. (c) Representative traces showing a significant increase in R333K KCNQ2 mutant by 200 μM diC8-PIP2 addition to patch pipette (red line) compared to controls (black line). KCNQ2 (WT) did not show apparent augmentations. Currents were elicited by voltage steps from -60 mV to +40 mV. (d) from data such as shown in c current densities for 0, 20, and 200 μM diC8-PIP2 in the recording pipette were determined and plotted as bars with S.E.M. Currents were measured at >20 min after rupturing the plasma membrane. The numbers in parentheses indicate the number of cells. ANOVA Tukey test. **p<0.01 versus corresponding concentration to WT. #p<0.05; ##p<0.01; ###p<0.001. (eg) Effects of Prmt1 (e-f) or 4RK mutation (g) on the binding of KCNQ2 and PIP2. Different amounts (10–500 pmol) of PIP2 were spotted onto nitrocellulose membranes and analyzed by a protein-lipid overlay procedure using cell lysate prepared from HEK293T cells transfected with indicated expression vectors or the control pcDNA vector (left panels). The control western blots are shown in right panels. (h) Left, representative traces show augmentation of M-current by 200 μM diC8-PIP2 in the patch pipette. Right, summary of M-current density from WT neurons and Prmt1+/- neurons with 0, 20, and 200 μM diC8-PIP2 in the recording pipette. Mean ± S.E.M. ANOVA Tukey test, ***p<0.001. (ij) the mean value of input resistance (i), and threshold current for AP generation (100 ms duration; j) from WT (+/+) neurons, mutants (+/-), and mutants loaded with 20 μM diC8-PIP2 (+/-; PIP2). (k) the mean number of APs in response to 1-s depolarizing current injection (200 pA) from a WT (+/+) neuron, a mutant (+/-), and a mutant loaded with 20 μM diC8-PIP2 (+/-; PIP2).

DOI: http://dx.doi.org/10.7554/eLife.17159.022

Figure 7—source data 1. Source data for Figure 7.
DOI: 10.7554/eLife.17159.023

Figure 7.

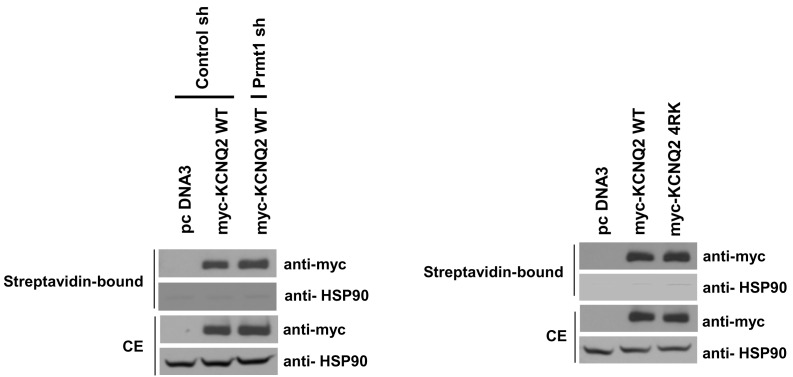
Figure 7—figure supplement 1. Surface expression of KCNQ channels was not affected by Prmt1 knockdown or 4RK mutation.

Figure 7—figure supplement 1.

Membrane surface biotinylation assays show that the ratio of channels on the membrane to those in the total lysates was not significantly different in control cells and Prmt1 knockdown cells (left). Also, 4RK (R333K/R345K/R353K/R435K) substitution in KCNQ2 does not affect the correct trafficking of channel to the plasma membrane (right).
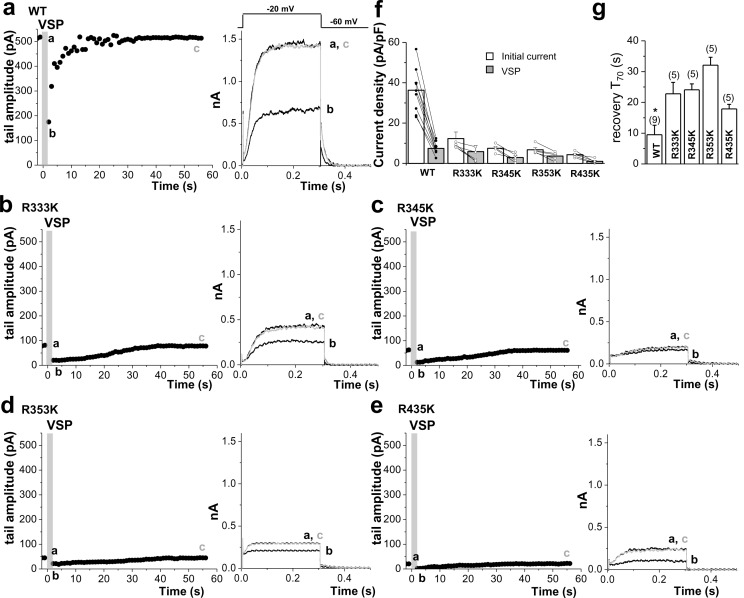
Figure 7—figure supplement 2. Quantitative determination of the sensitivity of KCNQ2 channels to activation of Dr-VSP in HEK293T cells.

Figure 7—figure supplement 2.

Tail current amplitudes were used to measure current inhibition by Dr-VSP activation and its recovery. (ae) Time course of tail current amplitude in a cell transfected with Dr-VSP and WT KCNQ2 (a), R333K (b), R345K (c), R353K (d), or R435K (e). Membrane was held at -60 mV and depolarized to -20 mV for 300 ms every 1 s, except for shaded area where membrane was held at +100 mV for 2 s. Tail currents were measured during slow channel deactivation at -60 mV. Right, superimposed currents at time points before VSP activation (a), after VSP activation (b), and during recovery (c). (f) Summary of tail current density at baseline (initial current) and right after VSP activation (VSP). (g) time to the 70% maximum current amplitude (T70) after VSP activation was measured for indicated WT KCNQ2 and RK mutants for recovery kinetics comparison (n = 5–9). Mean ± SEM shown. ANOVA Holm-Sidak test. *p<0.05 versus WT.
Figure 7—figure supplement 2—source data 1. Source data for Figure 7—figure supplement 2.
DOI: 10.7554/eLife.17159.026
Figure 7—figure supplement 3. Comparison of XE991 sensitivity in GCs.

Figure 7—figure supplement 3.

Changes in firing rate (a) and threshold current (b) in WT (+/+) neurons, mutants (+/-), and mutants loaded with 20μM diC8-PIP2 (+/-; PIP2) in response to 10 μM XE991. Each connected line represents an individual neuron. Closed circles give the averaged changes. No change in input resistance and firing rate occurred with 10 μM XE991 in mutants, whereas addition of 10 μM XE991 to mutants after PIP2 dialysis produced a substantial decrease in threshold current and increase in firing rate, as in WT GCs.
Figure 7—figure supplement 3—source data 1. Source data for Figure 7—figure supplement 3.
DOI: 10.7554/eLife.17159.028
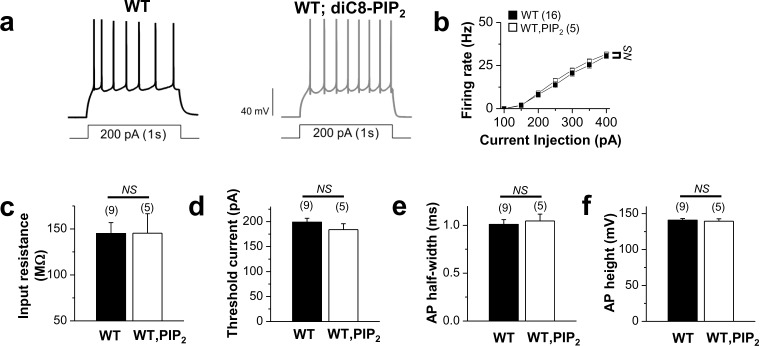
Figure 7—figure supplement 4. Application of exogenous PIP2 had little effect on the excitability in WT neurons.

Figure 7—figure supplement 4.

(a) representative trace in the whole-cell current-clamp recording from WT GCs with no PIP2 (left) or 20 μM diC8-PIP2 in the patch pipette (right) in response to 1-s depolarizing current injection (200 pA). (b) the mean number of action potentials (AP No.) plotted against the eliciting currents (from 100 pA to 400 pA, + 50 pA increment, during 1-s). (cf) summary of input resistance (c), threshold current for AP generation (100 ms duration; d), AP half-width (e), and AP height (f) from WT mature dentate GCs when loaded with no PIP2 or 20 μM diC8-PIP2. Mean ± S.E.M. The numbers in parentheses indicate the number of cell tested.
Figure 7—figure supplement 4—source data 1. Source data for Figure 7—figure supplement 4.
DOI: 10.7554/eLife.17159.030
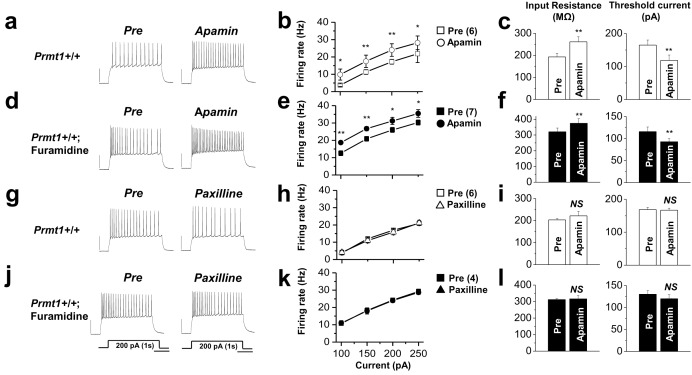
Figure 7—figure supplement 5. The effects of SK channel block and BK channel block on neuronal excitability of control or furamidine-pretreated GCs.

Figure 7—figure supplement 5.

Spike trains were evoked by injecting 1-s depolarizing current pulses of different intensities (100–250 pA) into the cell before and after application of apamin (af) or paxilline (gl) in control or furamidine (20 μM, 1 hr)-pretreated GCs. Examples of APs during 200-pA current injection without (left) and with the SK channel blocker apamin (100 nM) or the BK channel blocker paxilline (5 μM) (a,d,g,j). Number of APs evoked after injection of different currents (b,e,h,k). Apamin increases the firing frequency in both control and furamidine-pretreated GCs. Paxilline has little effect on firing frequency in both control and furamidine-pretreated GCs. The mean value of input resistance (left) and threshold current for AP generation (100 ms duration; right) (c,f,i,l). Error bars, S.E.M. scale bar; 40 mV, 300 msec. *p<0.05; **p<0.01 by paired Student’s t-test.
Figure 7—figure supplement 5—source data 1. Source data for Figure 7—figure supplement 5.
DOI: 10.7554/eLife.17159.032