. 2016 Aug 23;5:e13424. doi: 10.7554/eLife.13424

Figure 2. Three hours of recovery sleep restores spine numbers and dendrite length of CA1 neurons in the hippocampus.

(A) Golgi analyses indicated that three hours of recovery sleep after 5 hr of sleep deprivation restores the total number of spines per apical/basal dendrite of CA1 neurons (n = 6, Student’s t-test, p>0.05). (B) Three hours of recovery sleep after 5 hr of sleep deprivation restores apical/basal dendrite length of CA1 neurons (n = 6, Student’s t-test, p=0.173). (C, D) Three hours of recovery sleep restores apical/basal spine numbers at all distances from the soma (Student’s t-test, p>0.05 for each distance from soma, C) and at each branch number (Student’s t-test, p>0.05 for each branch number, C). NSD: non-sleep deprived, RS: Sleep deprivation + recovery sleep. Values represent the mean ± SEM. See also Figure 2—figure supplement 1 for separate Golgi analyses of apical and basal spine numbers.

DOI: http://dx.doi.org/10.7554/eLife.13424.006

Figure 2.

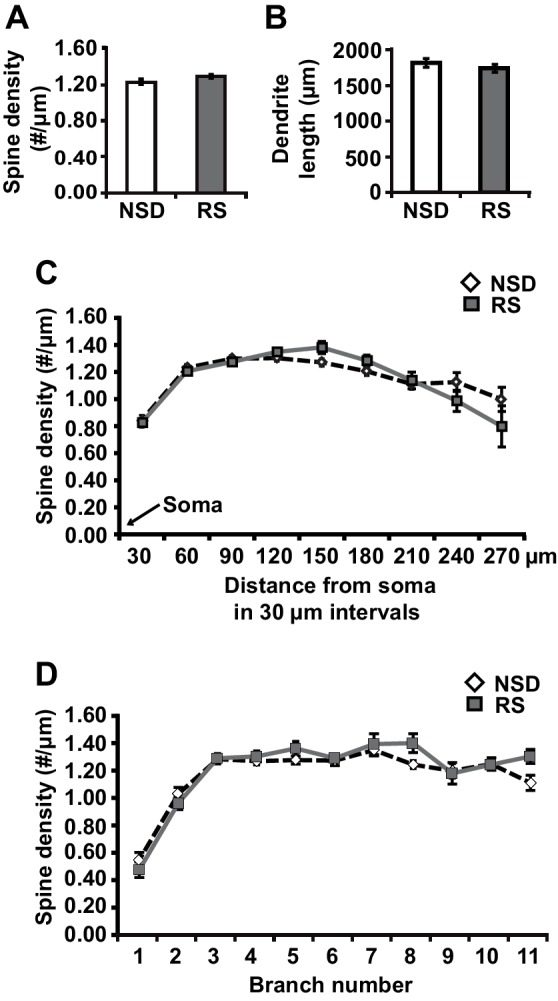
Figure 2—figure supplement 1. Three hours of recovery sleep after 5 hr of sleep deprivation is sufficient to restore spine numbers and dendrite length in both basal and apical dendrites of CA1 neurons.

Figure 2—figure supplement 1.

(A) Recovery sleep leads to increased spine density in apical dendrite of CA1 neurons (6 animals per group, 4 neurons per animal, Student’s t test p<0.05). (B) Recovery sleep restores basal and apical dendrite length of CA1 neurons (6 animals per group, 4 neurons per animal, Student’s t test p>0.16). (C) Recovery sleep restores the number of all spine types in basal dendrites of CA1 neurons with the exception of branched spines (6 animals per group, 4 neurons per animal, Student’s t test p>0.15; branched spines Student’s t test p<0.05). (D) Recovery sleep restores the number of all spine types in apical dendrites of CA1 neurons with the exception of branched spines which are increased by recovery sleep (6 animals per group, 4 neurons per animal, Student’s t test p>0.4; filopodia spines Student’s t test p<0.05). (E) Recovery sleep restores the spine density of basal dendrites at all distances of the soma (6 animals per group, 4 neurons per anima, Student’s t test p>0.05). (F) Recovery sleep restores the spine density of apical dendrites between at all distances from the soma (6 animals per group, 4 neurons per animal, Student’s t test p>0.05). (G) Recovery sleep restores the spine density of basal dendrites of hippocampal CA1 neurons at all branch numbers (6 animals per group, 4 neurons per animal, Student’s t test p>0.05). (H) Recovery sleep restores the spine density of apical dendrites of hippocampal CA1 neurons at all branch numbers with exception of the seventh branch (6 animals per group, 4 neurons per animal, Student’s t test p>0.05; branch 7 Student’s t test p<0.05). NSD: non-sleep deprived, RS: recovery sleep. Values represent the mean ± SEM. *p<0.05, by Student’s t test.