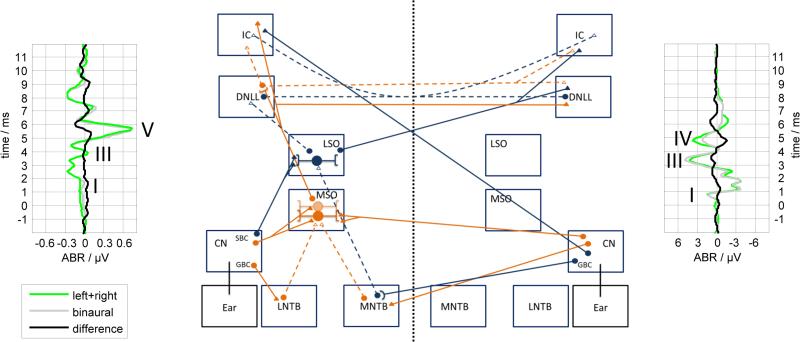
Figure 3.
Schematic of the mammalian interaural level (ILD) and interaural time difference (ITD) circuit. The boxes indicate the different brain nuclei (CN: Cochlear Nucleus, GBC: Globular Bushy Cells, SBC: Spherical Bushy cells, LNTB: Lateral Nucleus of the Trapezoid Body, MNTB: Medial Nucleus of the Trapezoid Body, MSO: Medial Superior Olive, LSO: Lateral Superior Olive, DNLL: Dorsal Nucleus of the Lateral Lemniscus, IC: Inferior Colliculus). Blue solid lines represent excitatory input for the ILD circuit, whereas blue dashed lines indicate inhibitory input. Orange solid lines show excitatory input for the ITD circuit and orange dashed lines inhibitory input. An exemplary ABR from a human subject (Riedel & Kollmeier 2002a) and from a gerbil are shown on the left and right side, respectively. The complete set of connections is obtained by mirroring the figure with respect to the dotted line since all connections shown have a counterpart originating from the other side. Cell bodies are indicated by circles. Synapses are indicated by triangles, whereas filled triangles represent excitatory synapses and empty triangles inhibitory ones.

