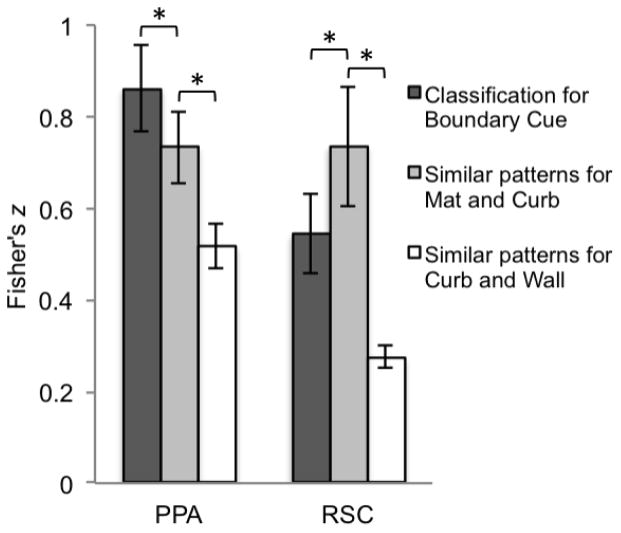
Figure 10.
Average Fisher’s z values for the PPA and RSC, obtained by calculating correlation values between neural data and the three models (Classification for boundary cue, Similar patterns for mat and curb, and Similar patterns for curb and wall) (significance determined by t-test, p < .05, two-tailed). Error bars represent one standard error of the mean. There is a significant interaction of ROI and model (not depicted).

