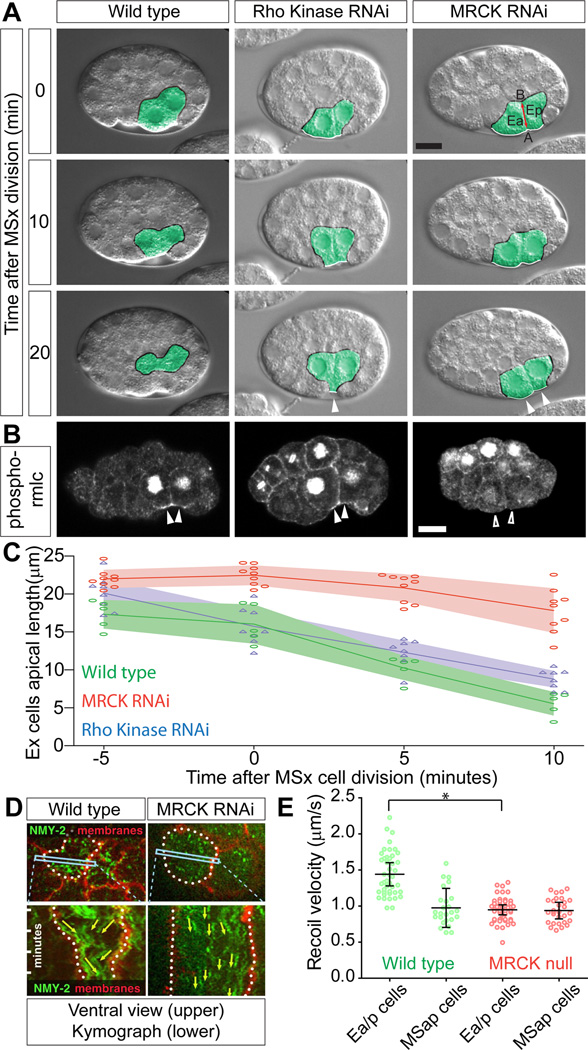
Figure 1. MRCK-1 and Rho Kinase are required for early gastrulation movements in C. elegans, and MRCK-1 regulates apical myosin. See also Figure S1 and Movie S1.
(A) Internalization of the two EPCs (Ea and Ep, pseudocolored green). The exposed surfaces of these cells (marked with white border, changed to black when covered) become completely covered by the neighboring cells within 20 minutes of MSx division. In Rho Kinase (let-502) and mrck-1 RNAi embryos there were still exposed surfaces at the 20 minute time point (arrowheads). Each panel is a single midsagittal optical section from a DIC time-lapse movie, with time since MSx division noted. In this and all figures, embryos are oriented with anterior to the left and dorsal up. In the top right panel, Ea and Ep are labeled, and the apical (A) – basal (B) axis of the EPCs is denoted by a red line. Scale bar represents 10 µm.
(B) Phosphorylated regulatory myosin light chain (rmlc) localization. Activated myosin was detectable at the apical cortex of EPCs in embryos with a temperature-sensitive mutation in Rho Kinase at the non-permissive temperature (arrowheads), but was absent from mrck-1 RNAi embryos (empty arrowheads). The antibody used also strongly marks nuclei prior to nuclear envelope breakdown and during cell division, which we consider as background staining because it is not eliminated by RNAi targeting regulatory myosin light chain (Lee et al., 2006). Scale bar represents 10 µm. Quantification from multiple embryos is found in Figure S1A.
(C) Quantification of the length of the apical (exposed) surfaces of the endoderm precursor cells in multiple embryos. Each point represents an individual embryo, and the lines represent the mean of several embryos. (mrck-1 RNAi n=9, Rho Kinase n=8, Wild type n=5). Shading represents 95% confidence intervals.
(D) Myosin (NMY-2, green) and membranes (marked using the PH domain from PLCδ, red, marked with dotted white line) were visualized in ventral mounts. A kymograph derived from a line across an EPC (box) showed that as the endoderm cell apical surfaces contracted, myosin foci moved toward the center of the apical cortex in wild type but not in an mrck-1 RNAi embryo.
(E) Recoil velocity of myosin particles in embryos that have been cut by UV laser incision, as a measure of relative cortical tension (Movie S1 [7]). Each point represents a single particle measured. The average recoil velocity was calculated in each embryo, and bars represent the mean of multiple embryos (wild type, Ea/p n = 9 embryos, MSap n = 5; mrck-1 null, Ea/p n=10, MSap n=6, * p=0.029). Error bars in all graphs are 95% confidence intervals (95%CI).

