Figure 1.
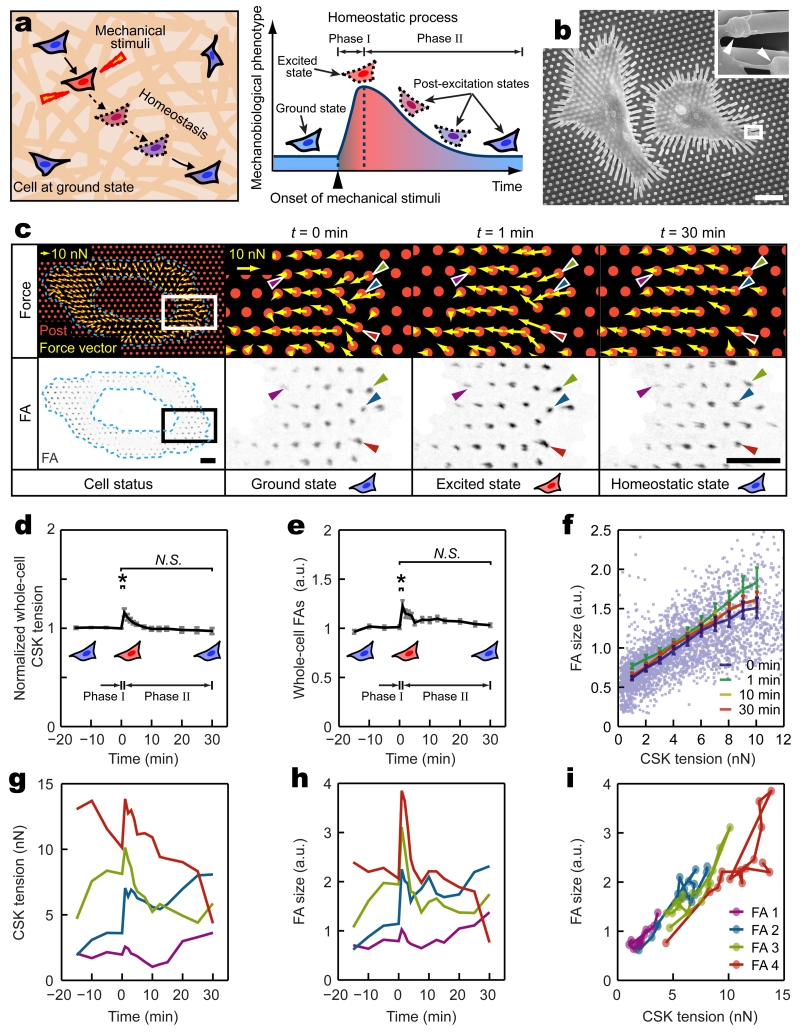
Dynamics of subcellular cytoskeleton (CSK) tension and focal adhesion (FA) during single-cell mechanical homeostasis. (a) Conceptual schematic of single-cell mechanical homeostasis. Upon mechanical perturbation, a biphasic cellular response comprising an excitation phase (Phase I) followed by another decay phase (Phase II) restores ground states of cellular mechanobiological phenotypes through actively regulated feedback mechanisms. (b) SEM image showing single REF-52 fibroblasts adhering to micropost tops through individual FAs marked by white arrows in the insert. White rectangle highlights the area in which inset SEM image was taken. Deflections of microposts were evident owing to CSK tension. Scale bar, 20 μm. (c) Top panel: force vector maps showing subcellular CSK tension (yellow arrows) exerted on micropost tops (red circles) in a single REF-52 fibroblast before (t = 0 min, ground state) and after (t = 1 min, excited state; t = 30 min, homeostatic state) the onset of 8% static equibiaxial stretch. Bottom panel: corresponding fluorescence microscopy images showing individual FAs and their one-to-one spatial registrations to subcellular CSK tension as illustrated by four single FAs marked by color-coded arrowheads. Region of interest enclosed by blue dashed polygons excluded the nucleus and perinuclear region where FA size and CSK tension were significantly lower compared with other subcellular regions. White (top) and black (bottom) rectangles marked areas where zoom-in images of subcellular CSK tension and FA were shown, respectively. Scale bar, 10 μm. (d&e) Temporal evolutions of normalized whole-cell CSK tension (d) and FA size (e) during single-cell mechanical homeostasis for REF-52 fibroblasts under 8% static equibiaxial stretch. Data for each single cell was normalized to ground-state values at t = 0 min. Data represents the mean ± s.e.m with n = 10. P-values were calculated using student’s paired sample t-test comparing data before (t = 0 min) and after (t = 1 min and 30 min) cell stretch. N.S., statistically insignificant and P > 0.05. *, P < 0.05. (f) Paired subcellular CSK tension - FA size data showing correlation during mechanical homeostasis. Data points represent individual FAs detected at t = 0 min. More than 2,500 FAs were analyzed from n = 10 REF-52 fibroblasts. Data trends are plotted as moving averages (solid lines) ± s.e.m. Mean results obtained at t = 0, 1, 10, 30 min are plotted as indicated. (g&h) Temporal evolutions of CSK tension (g) and FA size (h) for four representative single FAs (marked by color-coded arrowheads in c) during single-cell mechanical homeostasis. (i) Temporal trajectories of paired CSK tension - FA size data for the same four single FAs in g&h during single-cell homeostasis.

