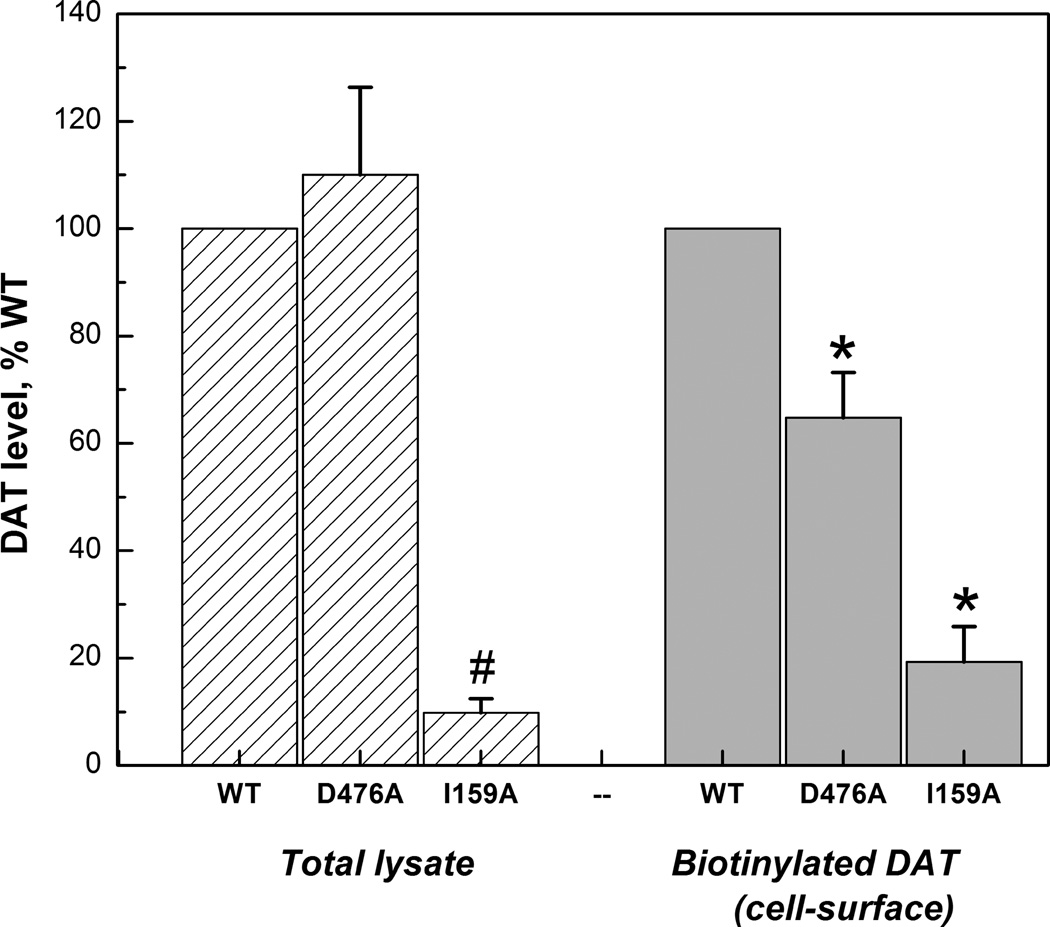
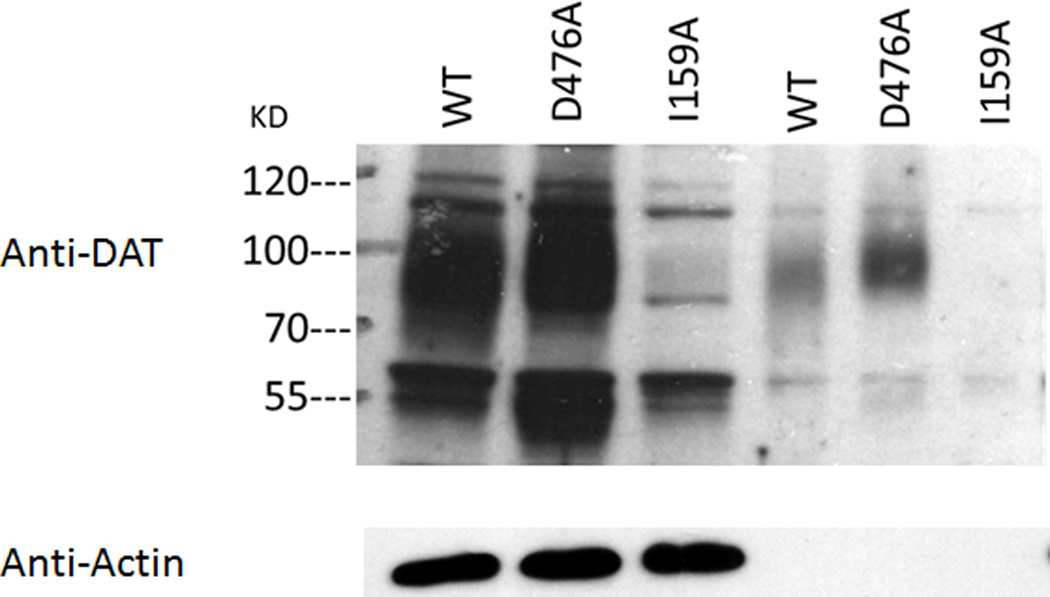
Figure 1.
Quantification of hDAT of total extraction and surface fraction in in LLC-PK1 cells stably expressing hDAT constructs (A) and the representative western blots (B). The integrated-density-value (IDV) for the protein hDAT are expressed as percentage of WT. Note that the bar graphs represent the average and SEM of all obtained results while the gel shown is one typical example.*: P<0.05 vs WT (one-Way ANOVA with post hoc Dunnett’s Method)


