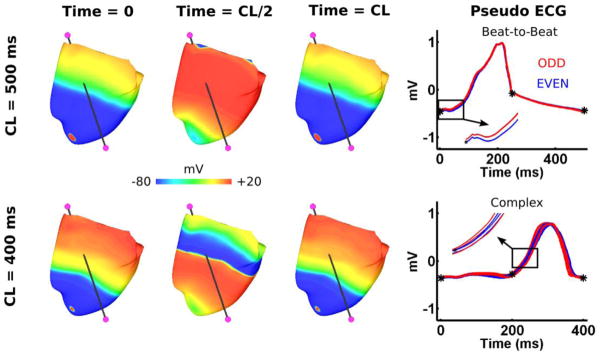
Figure 7. Pseudo-ECG for the failing HVM during apical pacing with CLs of 400 and 500ms.
The pseudo-ECG was computed by taking the basal extracellular voltage subtracted from the apical extracellular voltage (electrodes in magenta). Beat-to-beat alternans and complex oscillations in the pseudo-ECGs are shown by superimposing the odd (Red) and even (Blue) beats during the last 8 of 32 beats for the two pacing CLs. Transmembrane voltage maps are shown for the HVM at three different time points for the first of the last 8 superimposed beats.

