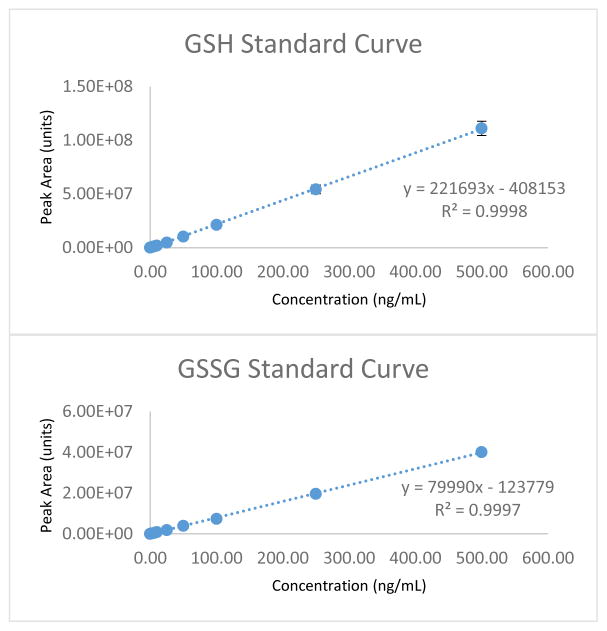
Figure 3.
The linear plots above are examples of typical standard curves for both GSH and GSSG. Although separate curves are generated, GSH and GSSG standardization of the LC-MS/MS system takes place simultaneously. 1 mg/mL standards for GSH and GSSG are prepared in 1% TCA (1.0 mM EDTA, 50% solvent A). These standards are then mixed at 10 μg/mL each and are subsequently diluted down in a stepwise fashion with 1%TCA (1.0 mM EDTA, 50% solvent A) to create the working solutions of standard and QC concentrations displayed in the linear range above. Fresh standards and QC’s are prepared the day sample analysis takes place.

