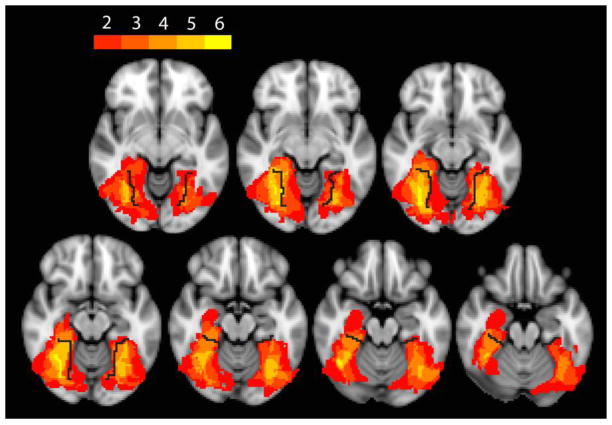
Figure 1. Overlap analysis of lesions on MRI.
An axial image of lesions from the six subjects with impaired hue discrimination, shown as a color spectrum from red to yellow, with red indicating regions involved by the lesion in only two subjects, and yellow indicating regions where the lesions of all six subjects overlapped. Black line indicates collateral sulcus.

