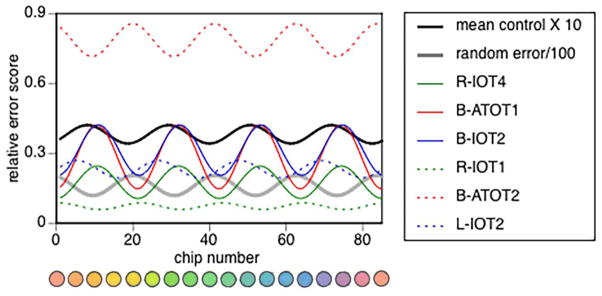
Figure 4. Fourth Fourier component analysis.
The components of all six subjects with dyschromatopsia are shown. Solid coloured lines indicate those subjects with large fourth Fourier components, and dashed lines those with more modest components. For comparison, the thick black line indicates the fourth Fourier component from the analysis of the mean control data, multiplied by 10 to facilitate the comparison. The thick grey line shows that from the analysis of random error, divided by 100 for facilitated viewing. The fourth Fourier component of the control data is in counterphase to that of the random error, indicating a slight over-correction by the procedure of Victor (1988).

