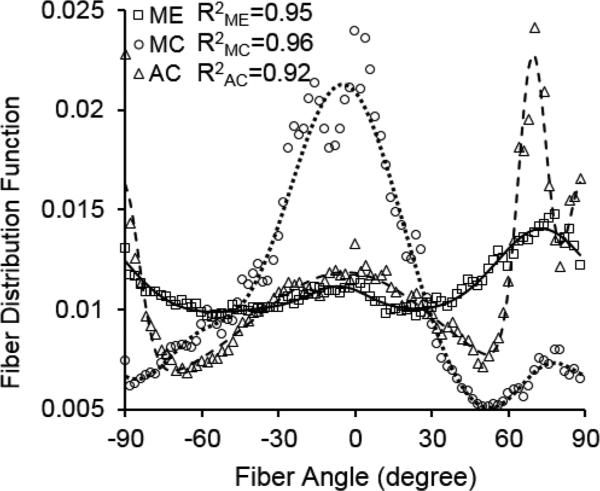
Figure 2.
Fiber orientation distributions of medial elastin (ME), medial collagen (MC), and adventitial collagen (AC) in porcine thoracic aorta when subjected to an equi-biaxial stretch of 140% in both the longitudinal and circumferential directions. Symbols represent measured distribution (Chow et al., 2014) and lines represent the corresponding three-term von Mises distribution function fitting. The R2 values represent correlation coefficients between the measured and fitted fiber distributions.

