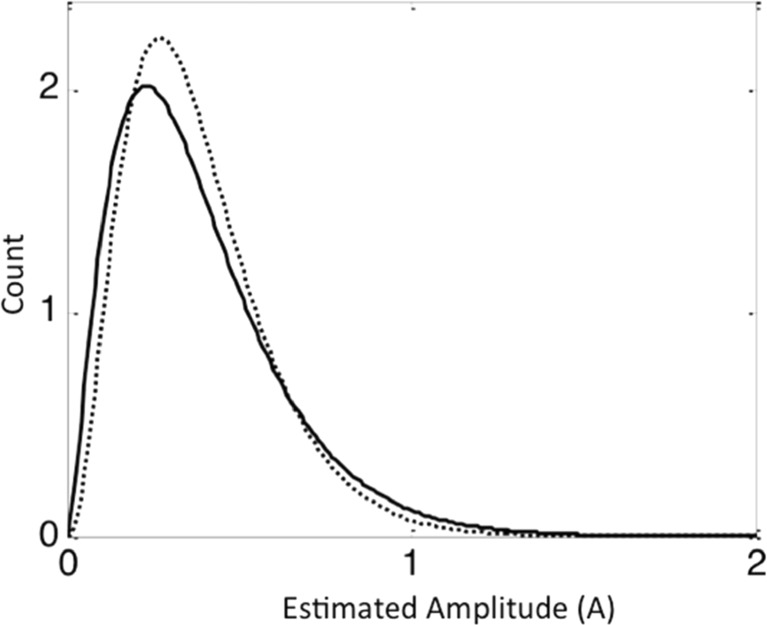
Fig. 5.
Gama distribution function from the non-dominant hand of heavy users (black line) compared to the non-dominant hand of non-heavy users (dotted line) in the Y-axis of the movement data. The low amplitudes in heavy users are significantly reduced compared to non-heavy users. The parameters are heavy users, Y-scale = 0.15 ± 0.11 and Y-shape = 2.49 ± 1.18, and non-heavy users Y-scale = 0.11 ± 0.09 and Y-shape = 3.41 ± 2.16

