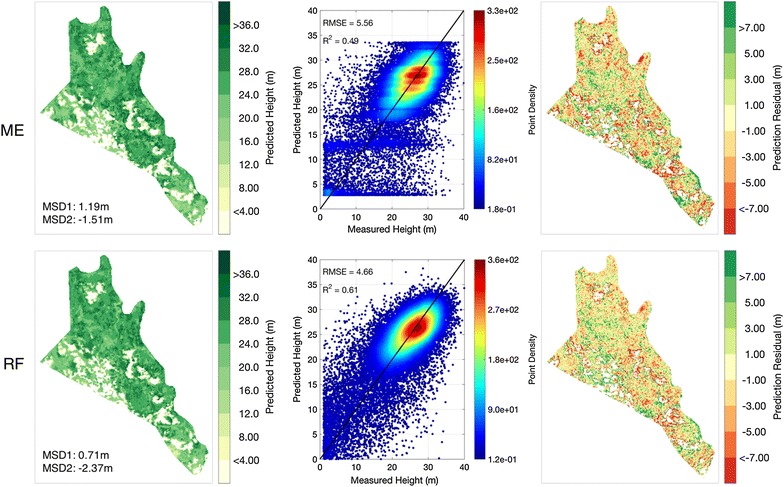
Fig. 4.

Bias-corrected results of ME (upper panels) and RF (lower panels) models. The first column shows the prediction maps of MCH, the second column shows the scatter plots of test samples, and the third column shows residual maps when comparing to the measured MCH
