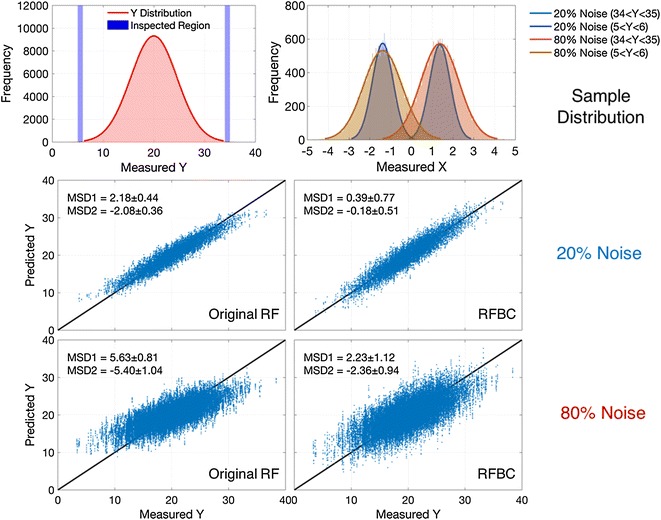
Fig. 7.

Model performance on the simulation data. The simulation data has two sets of independent variables (X)—with either 20 % noise or 80 % noise over the original X distribution. Sample distribution curves show two extreme examples of X distribution with large Y (34 < Y < 35, representing large trees) and low Y (5 < Y < 6, representing small trees). Original RF and RFBC were performed on these two sets of simulation data with half of the data as training and the rest as the independent test set
