
Fig 4. Findings for myeloid populations in spleen of Runx1+/+ and Runx1KTAMK/KTAMK mice.
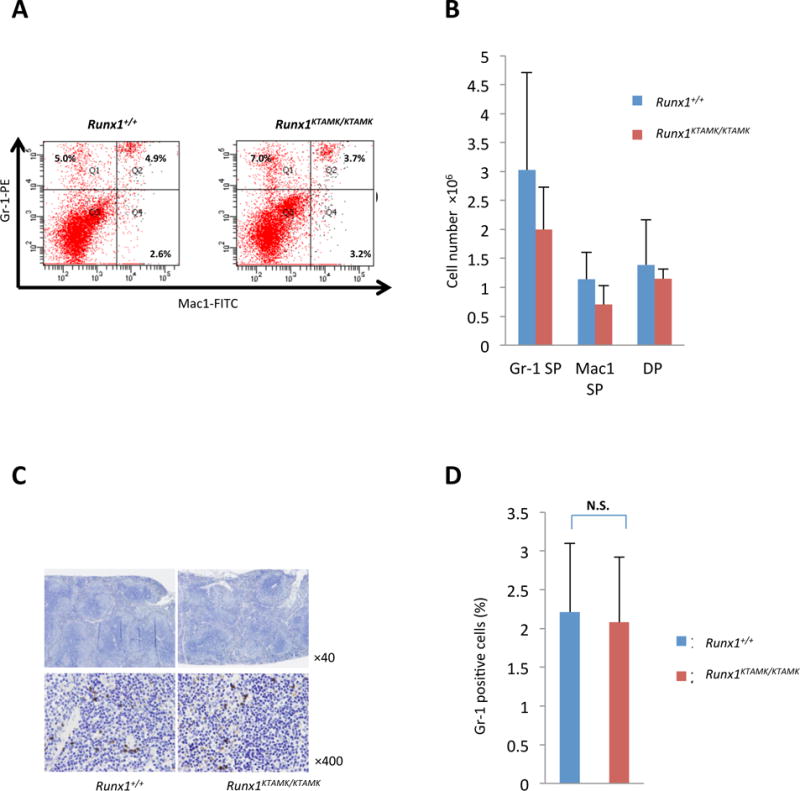
(A) Results of flow cytometric analysis of Mac1 and Gr-1 expression for splenocytes. Numbers in graph quadrants indicate fractions of the cells by percentile. Four mice for each group were analysed (Table S3) and representative results are shown. (B) Columns with bars for standard deviation indicate absolute numbers of Gr-1, Mac1 and double positive (DP) lymphocytes per spleen from littermate mice of each genotype. (C) Immunohistochemistry analysis of spleen of Runx1+/+ and Runx1KTAMK/KTAMK mice. Spleen tissue sections stained with antibody for Gr-1; original magnification ×40 and ×400. Three mice for each group were analysed, and representative results are shown. (D) Counts of the frequency of Gr-1 positive cells per high-power field (×400) in 20 fields. Bar graph shows the average positive ratio from 3 independent pairs of each group of mice. Runx1+/+ mice (2.21 ± 0.89 %) and Runx1KTAMK/KTAMK mice (2.08 ± 0.84 %) (P=0.86 t test). SP, single positive; N.S., not statistically different. Data are also shown as a table (Table S4).