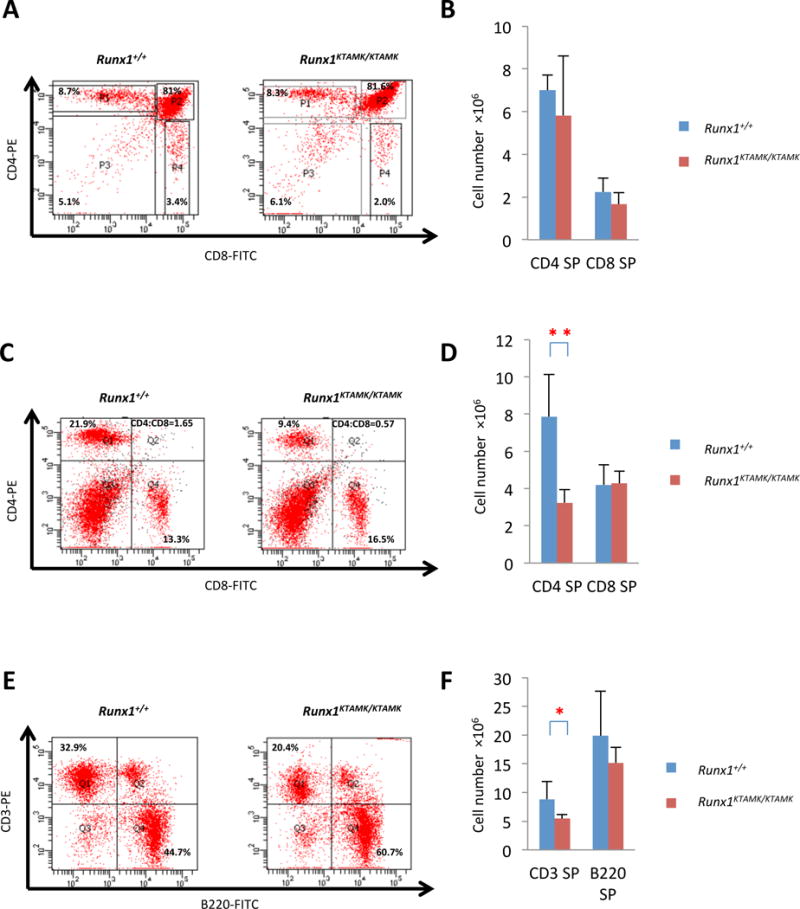
Fig 5. Findings for lymphoid populations in thymus and spleen of Runx1+/+ and Runx1KTAMK/KTAMK mice.

(A) Results of flow cytometric analysis of CD4 and CD8 expression for thymocytes. Four mice for each group were analysed, and representative data are shown. Numbers in graph quadrants indicate fractions of the cells by percentile. (B) Columns with bars for standard deviation indicate absolute numbers of CD4 or CD8 positive lymphocytes per thymocyte from littermate mice of each genotype. Data are also shown as a table (Table S5). (C) Results of flow cytometric analysis of CD4 and CD8 expression for splenocytes. Numbers in graph quadrants indicate fractions of the cells by percentile and CD4/8 ratio. Seven mice for each group were analysed, and representative data are shown. (D) Columns with bars for standard deviation indicate absolute numbers of CD4 or CD8 positive lymphocytes per spleen from littermate mice of each genotype. Statistically significant differences are shown as P values (**P<0.001 t test). Data are also shown as a table (Table S6). (E) Results of flow cytometric analysis of CD3 and B220 expression for splenocytes. Numbers in graph quadrants indicate fractions of the cells by percentile. Seven mice for each group were analysed, and representative data are shown. (F) Columns with bars for standard deviation indicate absolute numbers of CD3 or B220 positive lymphocytes per spleen from littermate mice of each genotype. Statistically significant differences are shown as P values (*P<0.01 t test). Data are also shown as a table (Table S7). SP, single positive
