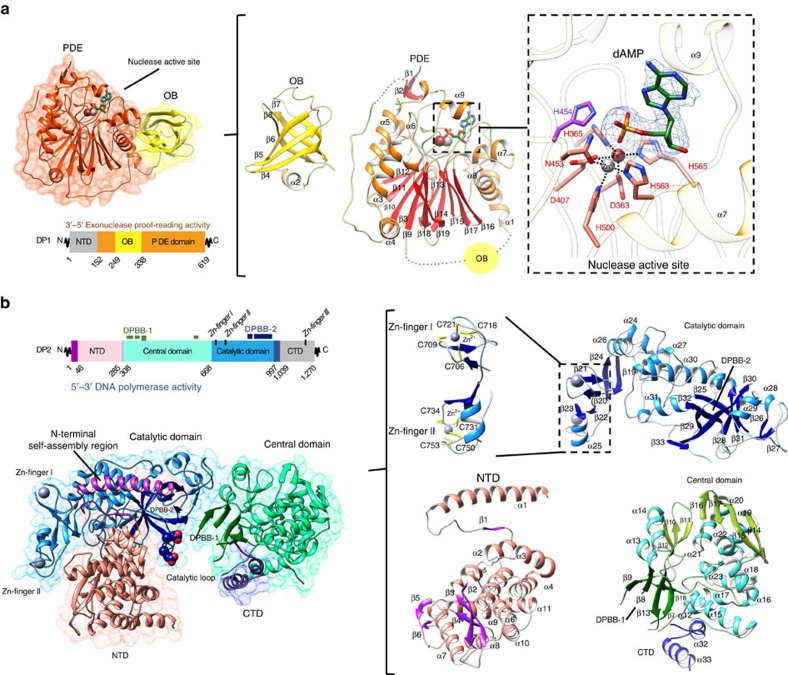
Figure 1. Overview of DP1 and DP2 structures.
(a) Left: cartoon representation of DP1 (144–622) coloured according to domains: PDE domain, orange; OB domain, yellow. Deleted regions, absent from the construct that was crystallized, are shown in grey. Centre: enlarged views of individual OB and PDE domains coloured by secondary structure. Right: structural details of the DP1 exonuclease active site. Catalytic residues and dAMP are shown as sticks. The blue mesh shows the Fo–Fc omit map electron density surrounding dAMP contoured at 3.0σ. (b) Left: cartoon representation of DP2 (1–1,050) coloured according to domains: N-terminal self-assembly region, purple; NTD, pink; central domain, cyan; catalytic domain, blue; CTD, dark blue. The aspartic side chains of the conserved D956 and D958 catalytic residues are shown as spheres. Deleted regions, absent from the construct that was crystallized, are shown in grey. Right: enlarged views of individual DP2 domains coloured by secondary structure. Zn2+ ions are shown as spheres, and side chains of the cysteine-coordinating residues are shown as sticks.

