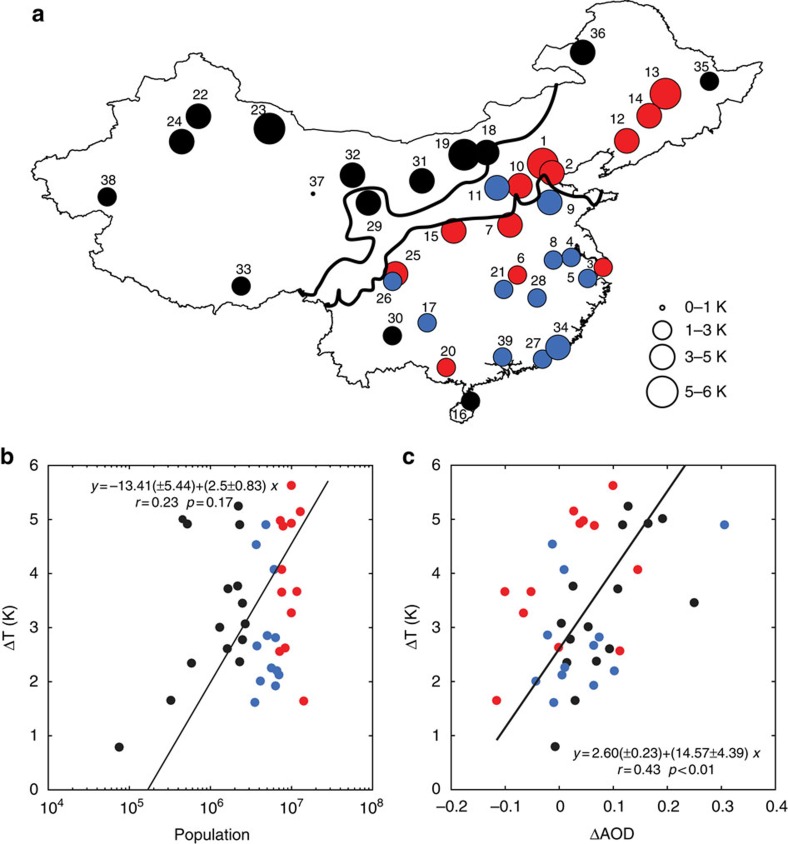
Figure 1. Nighttime MODIS surface urban heat island intensity in mainland China from 2003 to 2013.
(a) Spatial variation of the annual-mean nighttime MODIS-derived surface Urban Heat Island (UHI) across mainland China (K). (b) Surface UHI intensity relationship with population. (c) Surface UHI dependence on urban–rural AOD difference. Red, blue and black circles indicate large (population >7 million), medium (3–7 million) and small cities (<3 million), respectively. The two thick lines in a mark the boundary of three Köppen–Geiger climate zones (humid, semi-humid and semi-arid from south to north). Lines in b,c are linear regression with regression statistics noted. Errors on the regression parameters are 95% confidence bounds.

