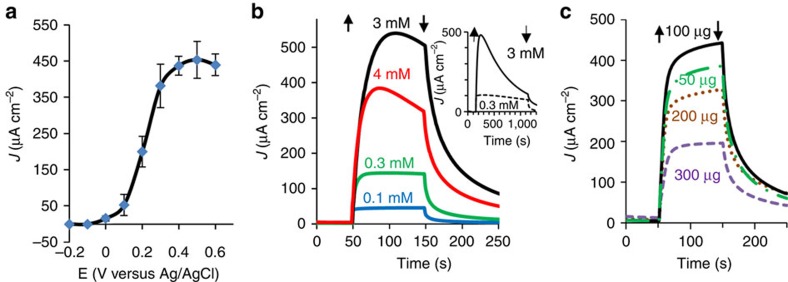
Figure 2. Photocurrent measurements in three-electrode mode.
(a) Photocurrent density as a function of the electrode potential, measured in buffer A solution with a thylakoid content of 0.1 mg Chl and Fe(III)CN concentration of 3 mM. The error bars represent the s.d. over four independent measurements. (b) The photocurrent, measured at an electrode potential of 0.5 VAg/AgCl, as a function of time during exposure to solar-simulated light between t=50 and 150 s. Four measurements in buffer A solution with a thylakoid content of 0.1 mg Chl and Fe(III)CN concentrations of 0.1, 0.3, 3 and 4 mM are presented (blue, green, black and red curves, respectively). The inset shows the long-term photocurrent stability in high (3 mM, full line) and low (0.3 mM, dashed line) Fe(III)CN concentrations. The arrows indicate light turn on (up) and off (down) points. (c) The photocurrent dependence on the amount of thylakoids (expressed in mg Chl) in solution. Maximal photocurrent was obtained with 100 μg Chl (black line), whereas 50, 200 or 300 μg Chl (green broken, brown dotted or purple dashed lines, respectively) yielded lower currents. The measurements were carried out in buffer A solution with 3 mM Fe(III)CN.

