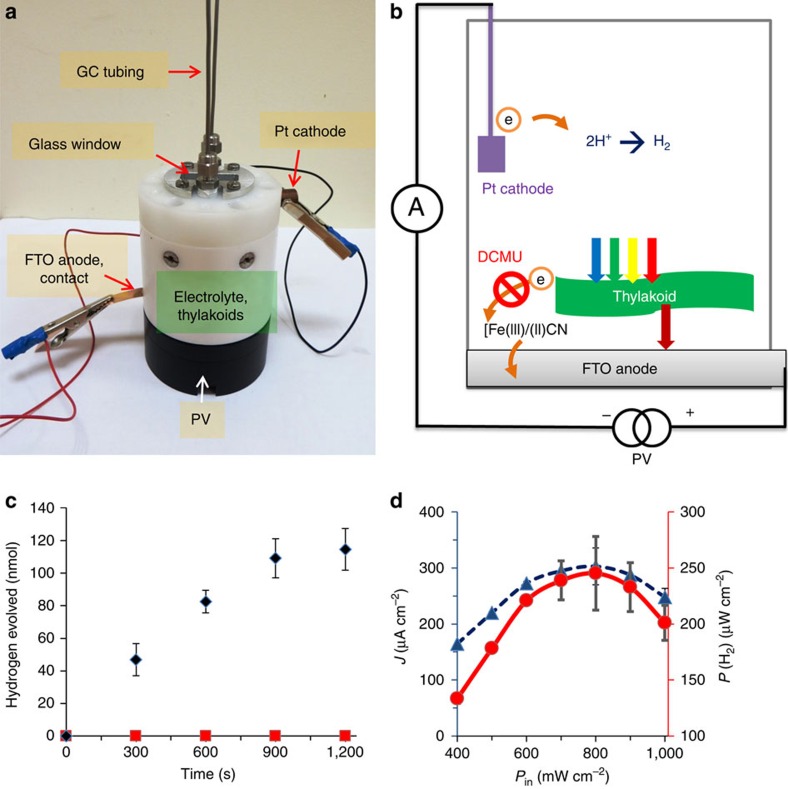
Figure 7. PV–BPEC tandem cell.
(a) Photograph of the tandem cell. (b) Illustration of the electron transfer pathway in the tandem cell. (c) Hydrogen evolution at the cathode in the presence (red squares) or absence (black diamonds) of the herbicide DCMU. (d) The influence of the incident light intensity (Pin) on the photocurrent (blue curve) and power accumulated in hydrogen bonds (red curve) produced by the tandem cell. The error bars in c,d represent the s.d. in four independent measurements.

