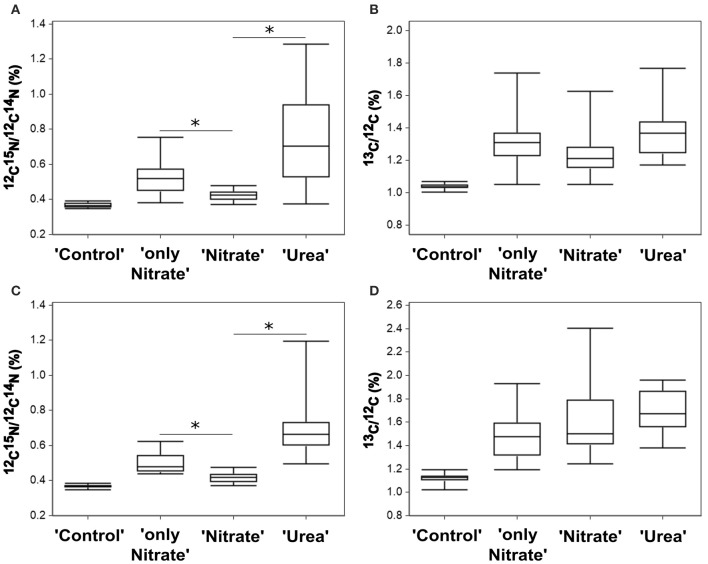
Figure 4.
Nutrient uptake by P. minimum measured at the single-cell level by NanoSIMS. (A) 15N-enrichment in the experiment E. (B) 13C-enrichment in the experiment E. (C) 15N-enrichment in the experiment F. (D) 13C-enrichment in the experiment F. Enrichments in 15N and 13C are expressed as 12C15N/12C14N and 13C/12C, respectively. “Control”—unlabeled cells; “only Nitrate”—15N-nitrate and 13C-bicarbonate uptake in the absence of urea; “Urea”—15N-urea and 13C-bicarbonate uptake in the presence of nitrate; “Nitrate”—15N-nitrate and 13C-bicarbonate uptake in the presence of urea. In each parallel, 15–26 cells were analyzed. The horizontal lines of Box-and-Whisker plots show the median, the hinges of the box show the 25th and 75th percentiles, and the whiskers show the entire range of 12C15N/12C14N and 13C/12C ratios. Individual values are provided in Supplementary Tables S1, S2. Enrichments of all labeled parallels are significantly higher than the enrichment of “Control” cells (Kruskal-Wallis test with the post-comparison Dunn's test, p > 0.05). The asterisks indicate significant differences between 15N-enrichment of the parallels “only Nitrate” and “Nitrate” (one-tailed Mann-Whitney test, p < 0.001 for both experiments) and the parallels “Nitrate” and “Urea” (Kruskal-Wallis test with the post-comparison Dunn's test, p > 0.05; one-tailed Mann-Whitney test, p < 0.001 for both experiments).

