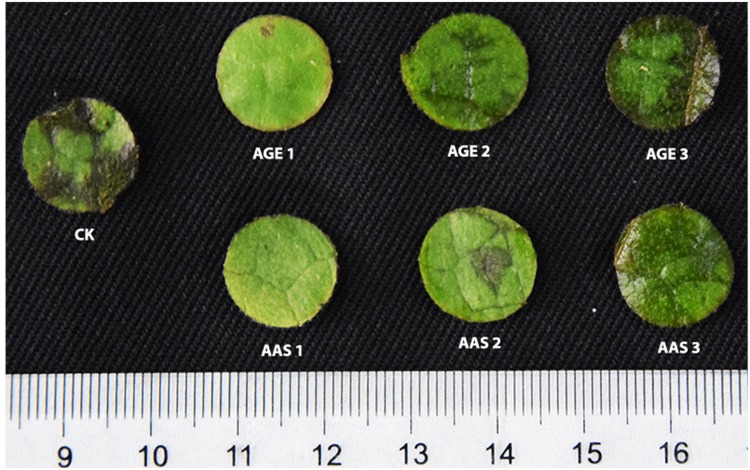
FIGURE 7.
Leaf disk showing antifungal activity of pure allicin AAS and AGE. CK represents Control, AGE1 (100 mg mL-1), AGE2 (50 mg mL-1), AGE3 (25 mg mL-1), AAS1 (3.9 mg g-1), AAS2 (0.39 mg g-1), and AAS3 (0.039 mg g-1). The amount of AAS is relative to that of allicin content of AGE quantified for G025 through HPLC.

