FIGURE 2.

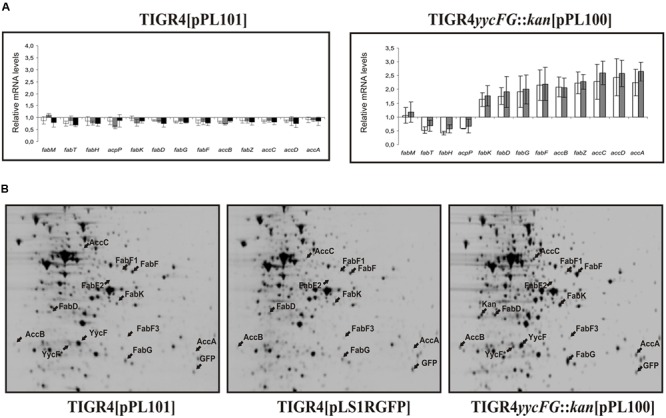
Transcriptional and proteomic analysis of the influence of YycFG induction on fatty acid biosynthesis in S. pneumoniae strains. Cultures of TIGR4[pLS1RGFP] (control strain), TIGR4 yycG::kan[pPL100] and TIGR4[pPL101] were induced with maltose. (A) shows the mRNA levels of fatty acid biosynthesis genes in strains TIGR4[pPL101] (left panel) and TIGR4 yycG::kan[pPL100] (right panel) relative to the control strain after 10 min (white bars), 30 min (gray bars) and long-term (black bars) induction. The length of the error bars represents the standard deviations on either side of the means. (B) shows the 2D gel electrophoretic analyses of total protein extracts of each strain after 30 min induction. Protein spots corresponding to the proteins listed in Table 2 and the kanamycin resistance (kan) protein are indicated by arrows.
