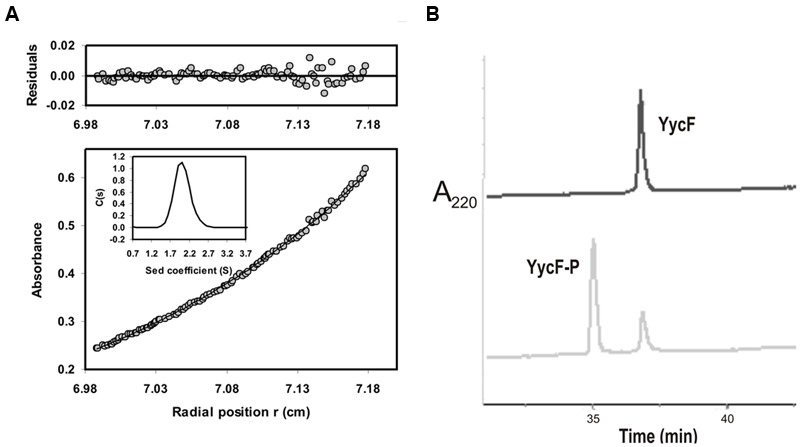
FIGURE 3.

Physicochemical analysis of YycF. Analytical ultracentrifugation profile of purified YycF (A). The sedimentation equilibrium profile of 20 μM YycF at 15,000 rpm, 20°C, measured at wavelength of 277 nm. Gray circles represent the experimental data; the continuous line is the best fit distribution for a single species at sedimentation equilibrium. The average molecular weight was 27,700 Da at this protein concentration. The residuals to the fit are shown in the upper part of the figure. Insert: Sedimentation velocity (50,000 rpm, 20°C) distributions of the same YycF preparation shown in the main figure. Chromatographic analysis of P-YycF and NP-YycF (B). The figure depicts the elution profile (detected by absorbance at 220 nm) of purified YycF after fractionation using a C4-HPLC column prior to (upper profile), or after (lower profile), phosphorylation with acetyl phosphate (see details in Materials and Methods).
