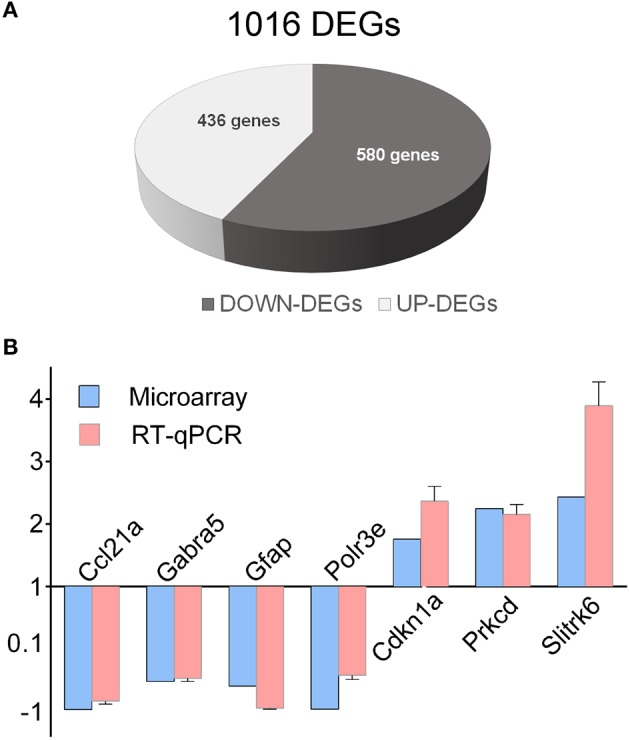
Figure 1.

Differentially expressed genes in the BTBR hippocampus. (A) Schematic representation of BTBR hippocampal DEGs, as compared to control B6 mice. A total of 1016 DEGs were identified, (580 down-regulated, 436 up-regulated). (B) qRT-PCR validation of differentially expressed genes. qRT-PCR results for all the evaluated genes were in agreement with microarray results. Values are expressed as each gene/L41 comparative quantitation ratios normalized on the expression of WT (mean ± s.e.m of three replicates from pools of six animals per genotype; p < 0.05, Student's t-test, BTBR vs. B6).
