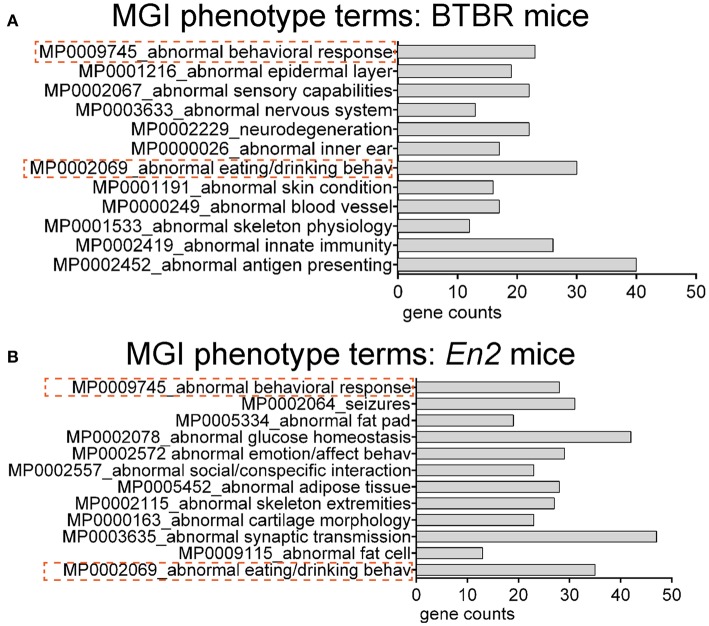
Figure 3.
Overrepresented mouse phenotype categories for differentially expressed genes in BTBR and En2−/− hippocampi. BTBR and En2−/− hippocampal DEGs were analyzed for enrichment in phenotype ontology categories using Enrichr, with an adjusted p < 0.05. For each category, the number of genes is indicated by the length of the horizontal bars (gene counts). Dashed red lines highlight phenotype categories common to BTBR (A) and En2−/− (B) DEGs.

