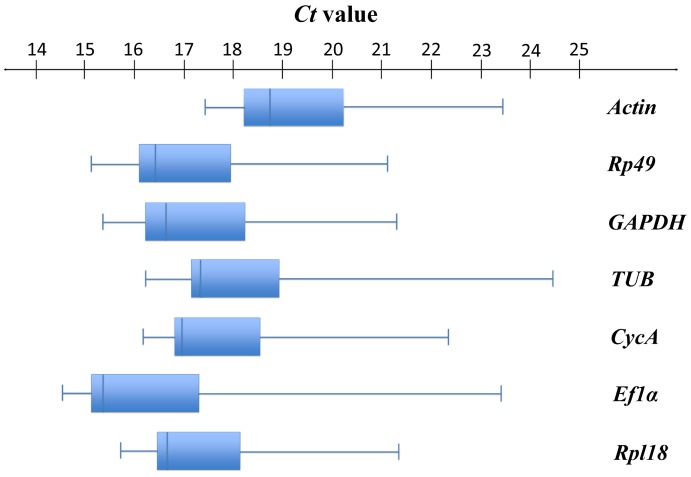
Figure 2.
Expression profiles of candidate housekeeping genes in T. urticae. Box-and-whisker plots show the expression levels of 7 candidate housekeeping genes in the total 84 samples documented in terms of the cycle threshold number (Ct value). The box represents the interquartile range (25th-75th percentiles). The line within a box stands for the median. The left and right whiskers on each box represent the lowest and the highest values, respectively.

