FIGURE 3.

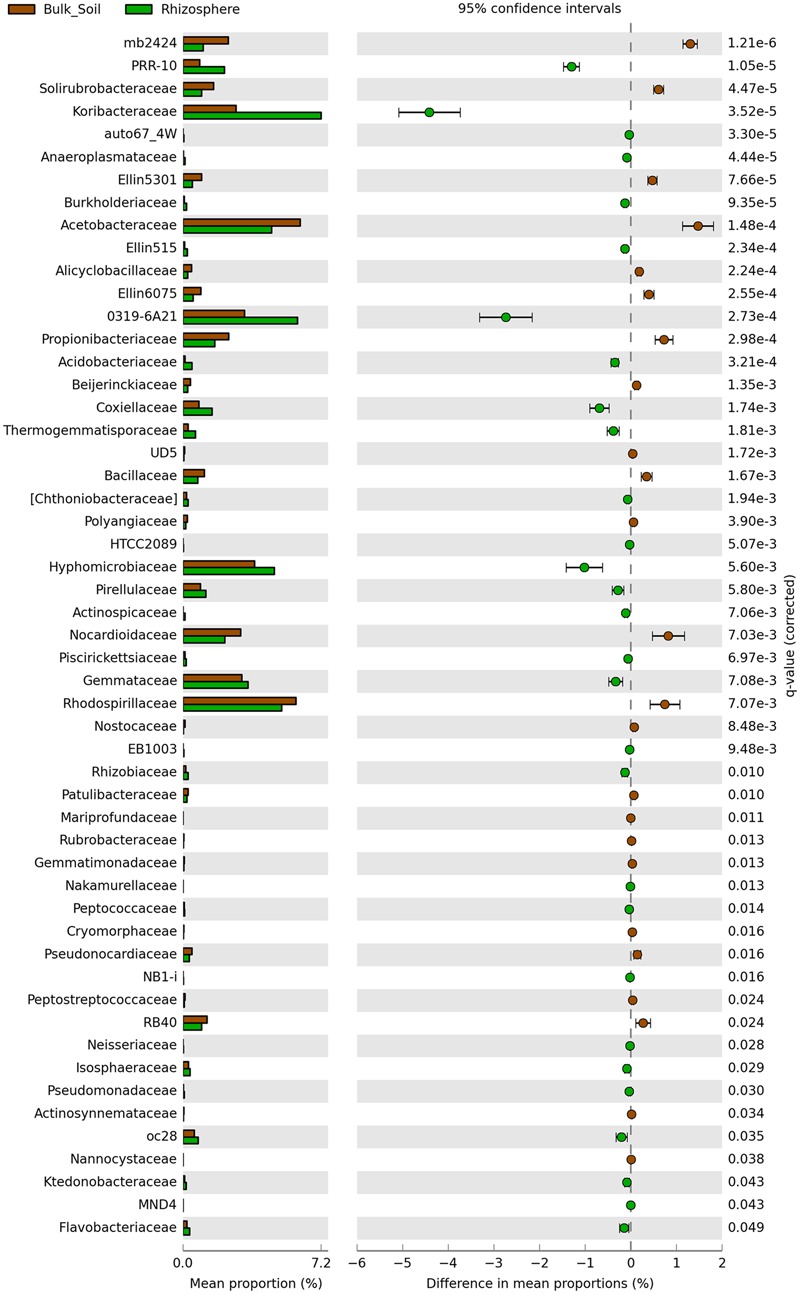
Statistical comparison (Welch’s t-test) between the families abundance on rhizosphere and bulk soil using the Benjamini-Hochberg P-value correction (P < 0.05).

Statistical comparison (Welch’s t-test) between the families abundance on rhizosphere and bulk soil using the Benjamini-Hochberg P-value correction (P < 0.05).