
FIGURE 4.
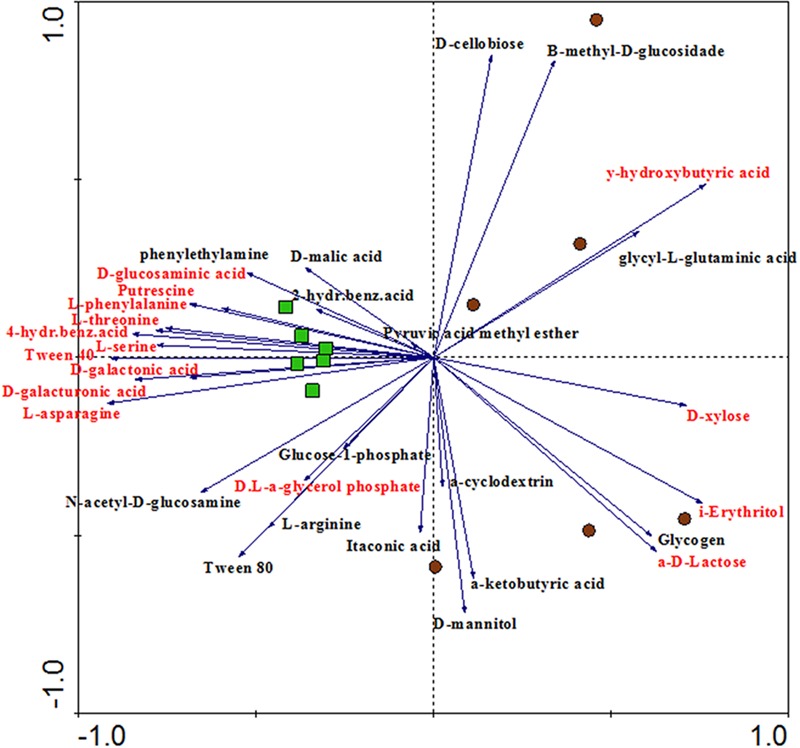
Principal component analysis (PCA) showing the ordination of rhizosphere and bulk soil samples according to the oxidation of C-sources in the CLPP analysis. Variables (C-sources) colored in red means significantly different between rhizosphere and bulk soil in the Tukey test (P < 0.05). Samples represented by green squares are from rhizosphere and samples represented by brown circles are from bulk soil (PC1 = 32.5%, PC2 = 21.3%).