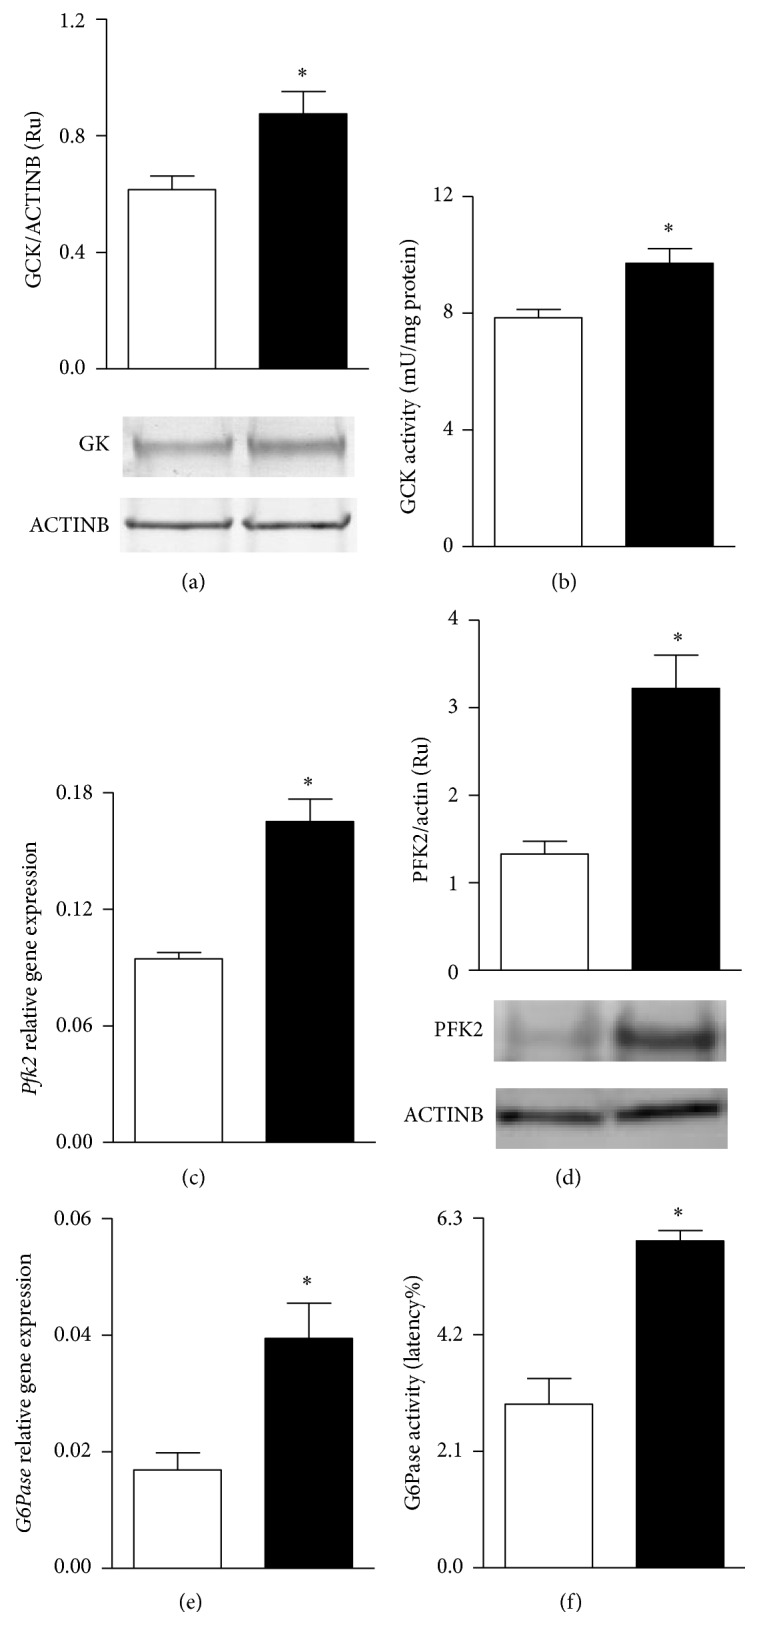
Figure 2.

Hepatic protein content and activity levels of GCK (panels (a) and (b), resp.), mRNA levels and protein content of PFK2 (panels (c) and (d), resp.), and mRNA levels and enzyme activity of G6Pase (panels (e) and (f), resp.) in control (white bars) and MSG-treated rats (black bars). Results are means ± SEM (n = 8 rats per group). ∗ P < 0.05 versus control values. Statistical analysis was performed by ANOVA, followed by Dunnett's test for multiple comparisons.
