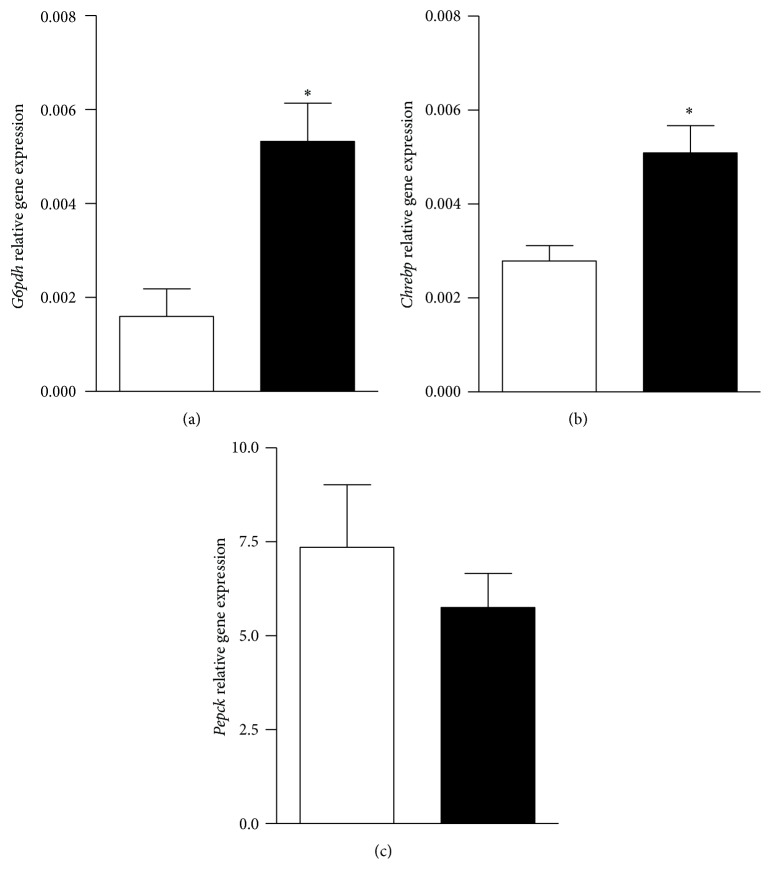
Figure 3.
Hepatic G6pdh (panel (a)), Chrebp (panel (b)), and Pepck (panel (c)) gene expression in control (white bars) and MSG-treated rats (black bars). Results are means ± SEM (n = 8 rats per group). ∗ P < 0.05 versus control values. Statistical analysis was performed by ANOVA, followed by Dunnett's test for multiple comparisons.

