
Figure 2. Dox-treatment effects on CDO vs. HFDO mammary tumor volume.
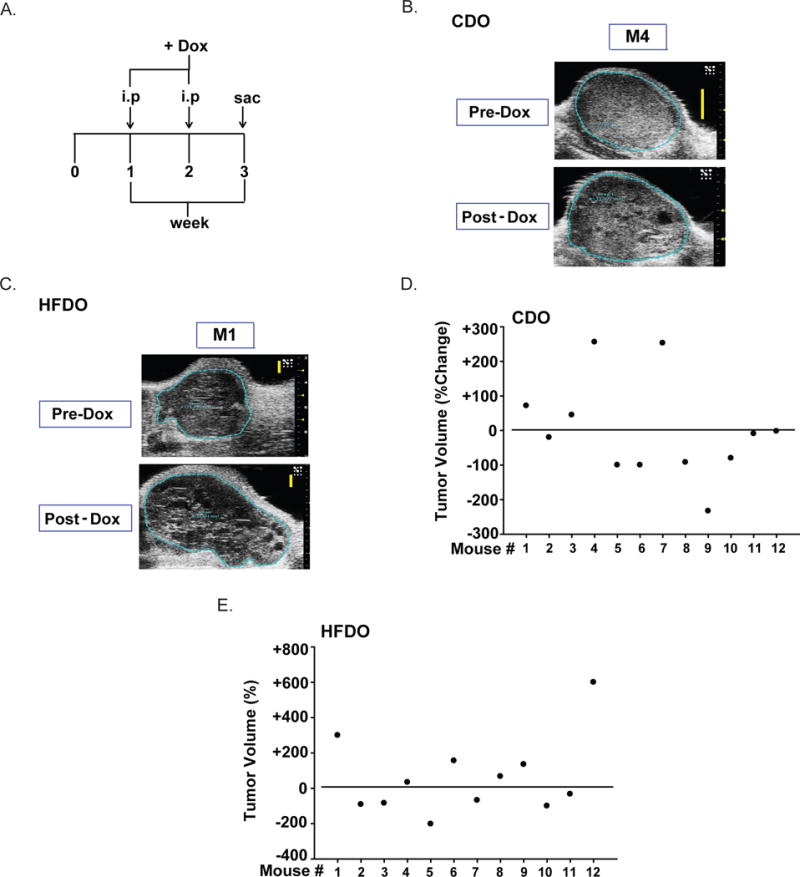
A. Treatment regimen. Dox (8 mg/kg body weight) was administered intraperitoneally to mice one week after tumor detection (designated as 0) and mice were sacrificed one week after the second Dox-treatment (week 3). Tumors were measured as described under Materials and Methods. Representative tumor scans for Dox-insensitive CDO (B) and HFDO (C) tumors. D, E. Percent changes in tumor volume for CDO (D) and HFDO (E) with Dox-treatments. Data for each mouse (n=12 individual mice) are shown. Basal value (pre-Dox) is designated as horizontal line across the entire graph. Percentages above and below the horizontal line refer to an increase (positive) or a decrease (negative), respectively in tumor volumes with Dox.