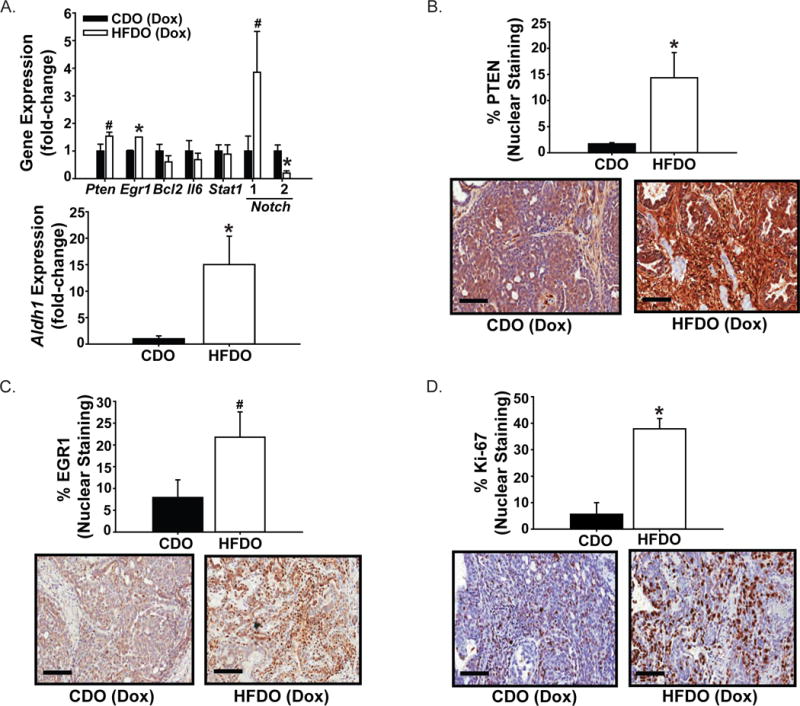
Figure 3. Gene expression in Dox-insensitive mammary tumors of CDO and HFDO.

A. Transcript levels were evaluated by QPCR and normalized to a factor from the geometric mean of expression of TATA-box binding protein, beta-actin and cyclophilin A, as described under Materials and Methods. Results (mean ± SEM; n=4 CDO and n=6 HFDO individual tumors) are presented as fold-change of gene expression. *P< 0.05 for CDO vs. HFDO. Representative sections immunostained for PTEN (B), EGR1 (C) and Ki-67 (D) are shown for CDO and HFDO tumors. The % of immunopositive cells for CDO and HFDO tumors (n=4 individual tumors/group) were analyzed a described under Materials and Methods. Values are reported as mean± SEM. *P< 0.05 for CDO vs. HFDO; #P=0.08. Magnification = ×20; scale bar = 100 μm.
