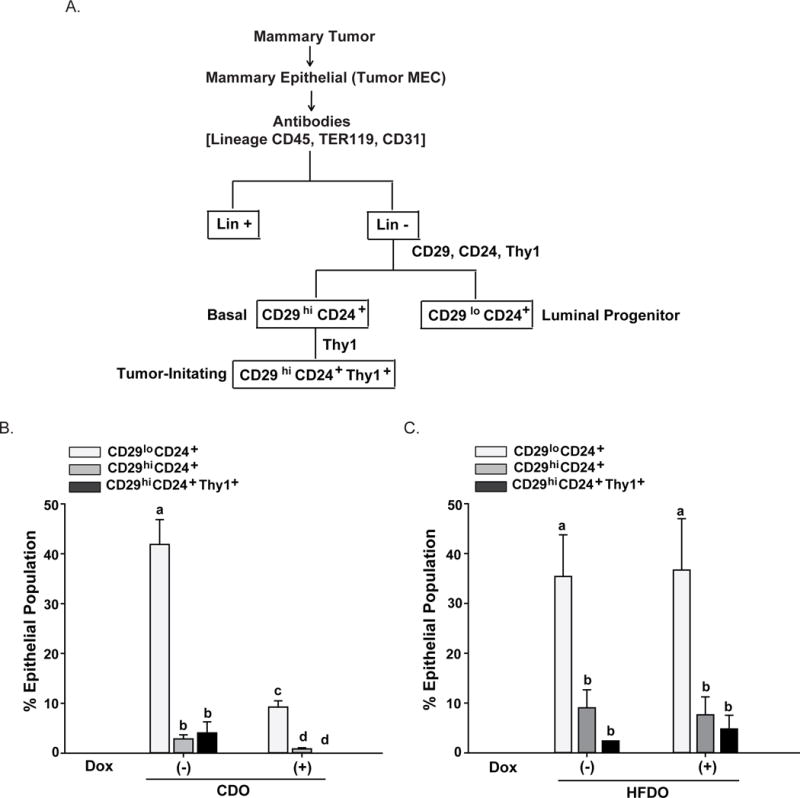
Figure 4. Frequencies of mammary epithelial subpopulations differ in mammary tumors of Dox-treated CDO and HFDO.

A. Schematic for gating strategy to identify mammary epithelial subpopulations from tumors using FACS. Cell subpopulations were designated based on their cell surface-markers following published studies for Wnt1-Tg mice (Cho et al., 2008; Rahal et al., 2013). B, C. Mammary tumors from CDO (B) and HFDO (C) prior to (−Dox) and post (+Dox) treatments were subjected to the procedures described in (A, above). Results shown are from 4 (CDO) and 5 (HFDO) independent experiments, with each experiment representing individual tumors from CDO and HFDO without (−Dox) and with (+Dox) treatment. Values are reported as mean ± SEM; different letter subscripts differed at P<0.05.
