FIGURE 6.

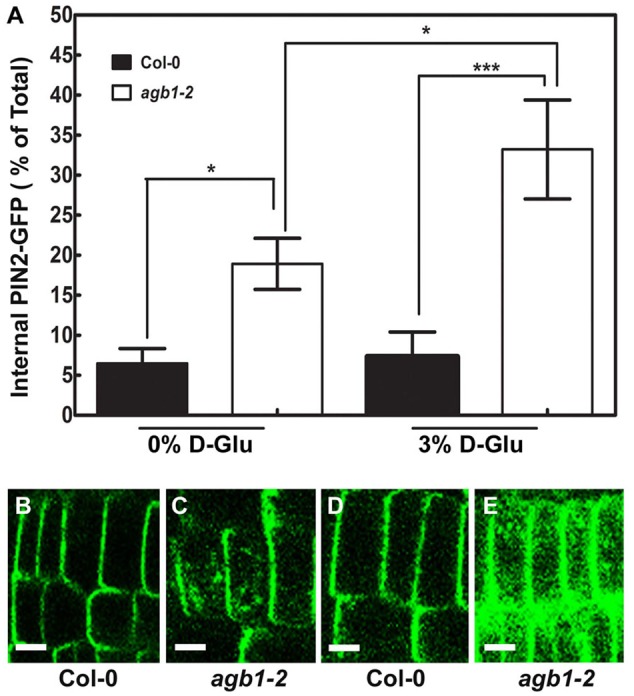
Altered subcellular localization of PIN2-GFP in the agb1-2 mutant. (A) Quantitation of PIN2-GFP subcellular localization in Col-0 and agb1-2 root tip cells grown with or without supplemental 3% glucose. Fluorescence intensities in multiple seedlings were measured using ImageJ software and compared using Student’s t-test, shown as asterisks:∗P < 0.05; ∗∗∗P < 0.0005. PIN2-GFP localization in Col-0 root tip cells (B,D) grown without (-) or with (+) supplemental 3% glucose, respectively. (C,E) Amount of PIN2-GFP internalized in agb1-2 root tip cells grown without (-) or with (+) supplemental 3% glucose, respectively. Scale bars represent 5 μm. In order to compare directly these genotypes, PIN2-GFP/agb1-2 lines were obtained by crossing agb1-2 plants into the PIN2-GFP line shown in panels B and D. This experiment was repeated three times and reproducible PIN2-GFP localization pattern was observed upon glucose treatment.
