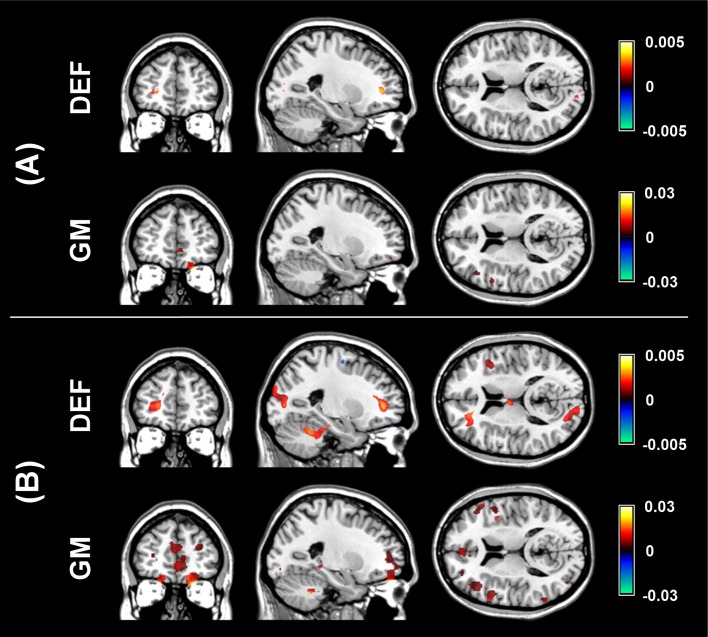
Figure 5.
Visualization of mean discriminative weights of local deformation (DEF) and gray matter (GM) volume features selected by pLDA with resampling (for λ = 1.6 and λ = 0.9, respectively) in: (A) all LOOCV(rc) iterations, (B) more than half of LOOCV(rc) iterations. The mean weights were calculated as an average of non-zero coefficients of v over 100 resampling iterations and 104 LOOCV(rc) folds.

