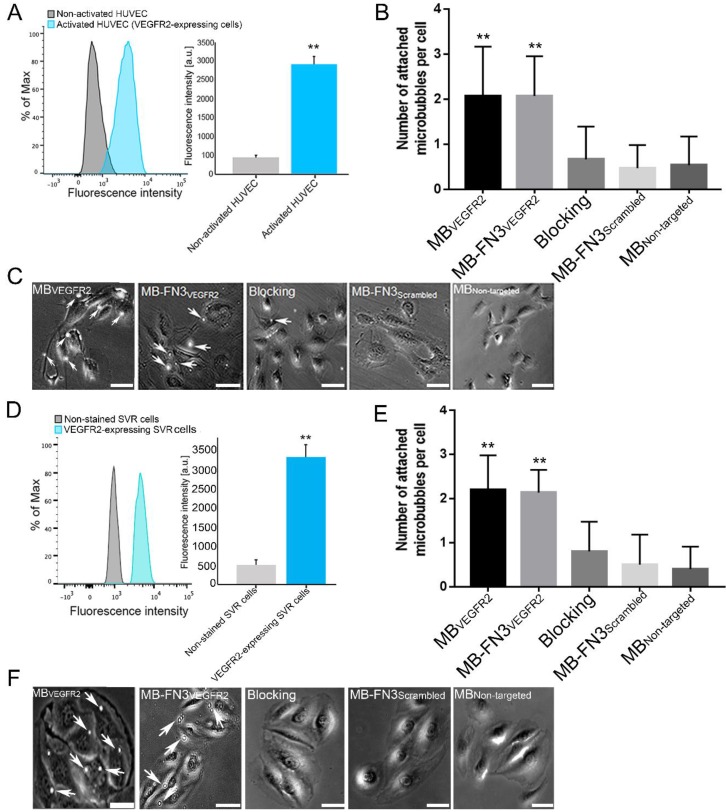
Figure 4.
A, activated HUVEC cells showed significantly increased fluorescence intensity on FACS, indicating strong VEGFR2 expression (**, P < 0.01) compared to non-activated HUVEC cells. B, C, representative photomicrographs from cell culture experiments using a parallel plate flow chamber setting with VEGFR2-expressing HUVEC cells exposed to MBVEGFR2, MB-FN3VEGFR2, MB-FN3Scrambled, and MBNon-targeted. There was significantly lower accumulation of MB-FN3Scrambled, MBNon-targeted, and MB-FN3VEGFR2 after blocking the receptors with the free FN3VEGFR2 compared with MB-FN3VEGFR2 (**, P < 0.01). D, mouse VEGFR2-expressing SVR cells showed significantly increased fluorescence intensity on FACS, indicating strong VEGFR2 expression (**, P < 0.01) compared to non-stained SVR cells. E, F, representative photomicrographs from cell culture experiments using a parallel plate flow chamber setting with VEGFR2-expressing SVR cells exposed to MBVEGFR2, MB-FN3VEGFR2, MB-FN3Scrambled, and MBNon-targeted. There was significantly lower accumulation of MB-FN3Scrambled, MBNon-targeted, and MB-FN3VEGFR2 after blocking the receptors with free FN3VEGFR2 compared with MB-FN3VEGFR2 (**, P < 0.01). MBs (arrows) are visualized as white spherical dots. Scale bar = 10 µm.

